Fig. 14
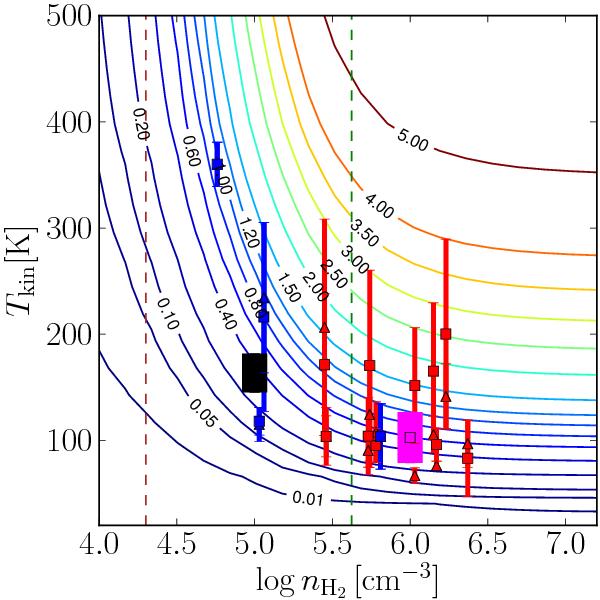
Model CO 10–9/3–2 line intensity ratios as function of temperature and density, obtained for a CO column density of 1016 cm-2 with line-widths of 10 km s-1, representative of the observed CO intensity and line width. Note that the bars are the ranges of lower and upper limits as seen from the observations in Fig. 13. Red markers are for Class 0 and blue markers are for Class I sources. Blue wing ratios are indicated with triangles and red wing ratios have square symbols. Thick magenta and black lines indicate the ratios from the composite spectra for Class 0 and Class I sources, respectively. Vertical dashed lines indicate the limits for ncr for CO 3–2 (brown) and CO 10–9 (green). In the relevant density range, higher ratios are indicative of higher kinetic temperatures.
Current usage metrics show cumulative count of Article Views (full-text article views including HTML views, PDF and ePub downloads, according to the available data) and Abstracts Views on Vision4Press platform.
Data correspond to usage on the plateform after 2015. The current usage metrics is available 48-96 hours after online publication and is updated daily on week days.
Initial download of the metrics may take a while.