Fig. 8
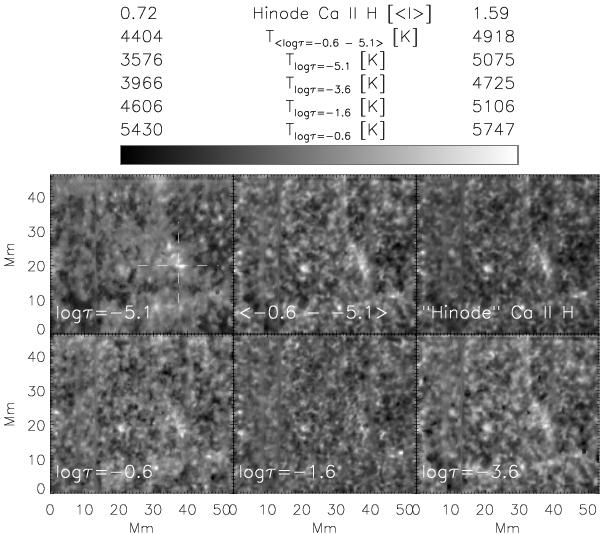
Temperature maps at disc centre. Bottom row, left to right: at optical depths of log τ = −0.6, − 1.6, and − 3.6. Top row, left to right: at log τ = −5.1, and averaged over − 0.6 to − 5.1. The top rightmost panel shows the synthetic Ca broad-band image. The white dashed lines in the temperature map at log τ = −5.1 denote the locations of the spatial cuts shown in Fig. 11.
Current usage metrics show cumulative count of Article Views (full-text article views including HTML views, PDF and ePub downloads, according to the available data) and Abstracts Views on Vision4Press platform.
Data correspond to usage on the plateform after 2015. The current usage metrics is available 48-96 hours after online publication and is updated daily on week days.
Initial download of the metrics may take a while.