Fig. 6
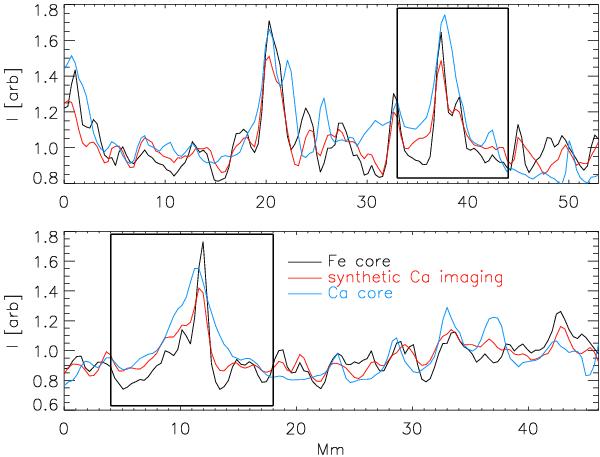
Cuts along the dotted white lines in Fig. 5 through the Fe line-core map (black lines), the synthetic Ca broad-band imaging (red lines) and the Ca line-core intensity map (blue lines). All intensities have been re-scaled to the same dynamical range by linear regression. The black rectangles mark locations of network and their surroundings.
Current usage metrics show cumulative count of Article Views (full-text article views including HTML views, PDF and ePub downloads, according to the available data) and Abstracts Views on Vision4Press platform.
Data correspond to usage on the plateform after 2015. The current usage metrics is available 48-96 hours after online publication and is updated daily on week days.
Initial download of the metrics may take a while.