Fig. 5
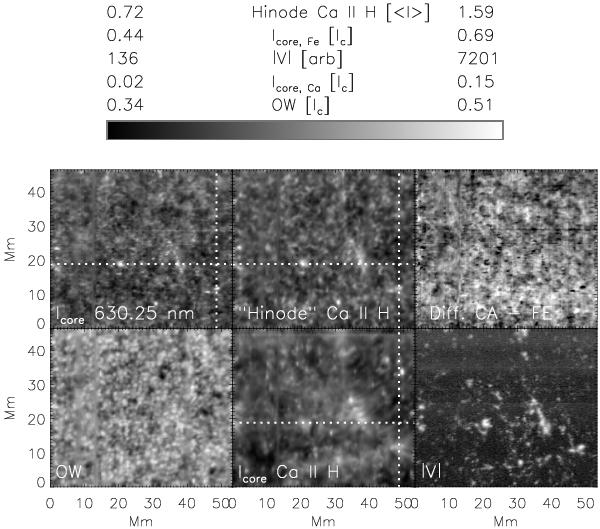
Overview maps of the POLIS observation at disc centre. Bottom row, left to right: OW, Icore of Ca ii H and Stokes | V | signal of the Fe i line 630.25 nm. Top row, left to right: Icore of Fe i at 630.25 nm, synthetic Ca broad-band imaging data and difference image of the latter two. The dotted white lines denote the locations of the cuts shown in Fig. 6.
Current usage metrics show cumulative count of Article Views (full-text article views including HTML views, PDF and ePub downloads, according to the available data) and Abstracts Views on Vision4Press platform.
Data correspond to usage on the plateform after 2015. The current usage metrics is available 48-96 hours after online publication and is updated daily on week days.
Initial download of the metrics may take a while.