Fig. 4
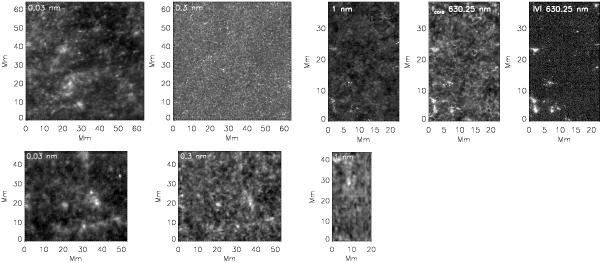
Disc centre observations with different filter widths. Top row, left to right: Ca ii K Lyot image (0.03 nm), Hinode/FG broad-band Ca ii H image (0.3 nm), MFBD-reconstructed Ca image (1 nm), co-spatial MOMFBD line-core image of Fe i at 630.25 nm and the unsigned wavelength-integrated Stokes V signal of this line recorded with the GFPI. Bottom row, left to right: synthetic images derived by applying the corresponding filters of the top row to Ca spectra observed at disc centre. The synthetic image for the 1-nm-wide filter was obtained from the Ca spectra taken with a PCO camera inside of POLIS at a different time. All images are scaled individually inside their full dynamical range.
Current usage metrics show cumulative count of Article Views (full-text article views including HTML views, PDF and ePub downloads, according to the available data) and Abstracts Views on Vision4Press platform.
Data correspond to usage on the plateform after 2015. The current usage metrics is available 48-96 hours after online publication and is updated daily on week days.
Initial download of the metrics may take a while.