Fig. 2
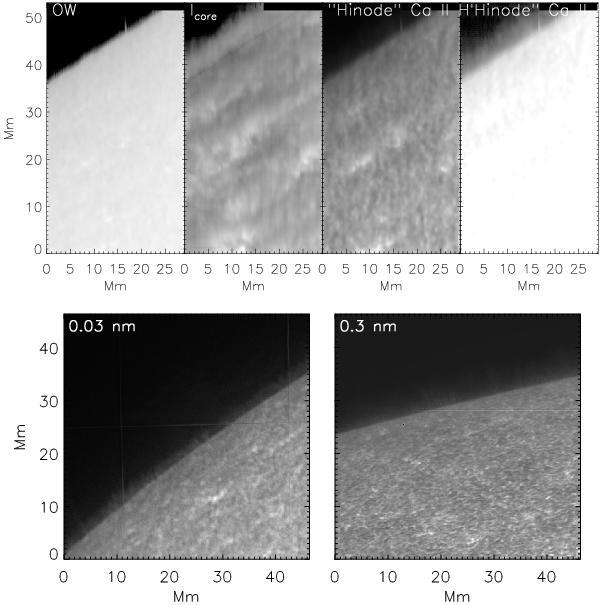
Overview of the observations at the solar limb. Top panel, left to right: 2D maps obtained from the spectra in the outer wing (OW), the line core (Icore, linear display), the synthetic Ca broad-band imaging data (linear display), and the same in logarithmic and clipped display. Bottom panel, left to right: contrast-enhanced Ca ii K Lyot-filter and Hinode Ca ii H broad-band filter images at the solar limb.
Current usage metrics show cumulative count of Article Views (full-text article views including HTML views, PDF and ePub downloads, according to the available data) and Abstracts Views on Vision4Press platform.
Data correspond to usage on the plateform after 2015. The current usage metrics is available 48-96 hours after online publication and is updated daily on week days.
Initial download of the metrics may take a while.