Fig. 11
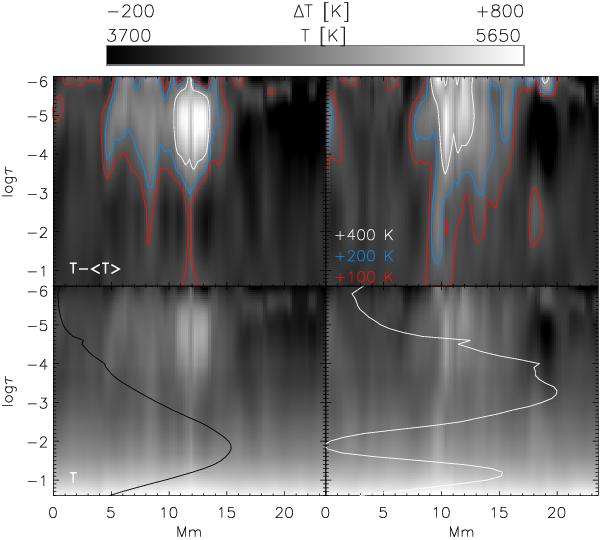
Spatial cuts through temperature maps at disc centre. Bottom row: modulus of the temperature. Top row: relative temperature fluctuations after subtraction of the average temperature stratification. Left column: cut in y. Right column: cut in x. The black and white line in the bottom row indicate the response of a 0.3-nm-wide filter and the difference image of broad-band Ca imaging and Fe i line-core intensity, respectively.
Current usage metrics show cumulative count of Article Views (full-text article views including HTML views, PDF and ePub downloads, according to the available data) and Abstracts Views on Vision4Press platform.
Data correspond to usage on the plateform after 2015. The current usage metrics is available 48-96 hours after online publication and is updated daily on week days.
Initial download of the metrics may take a while.