Fig. 10
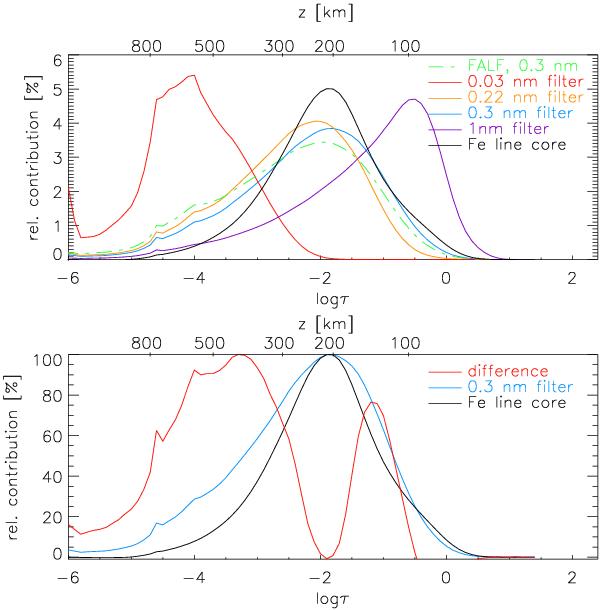
Relative intensity response functions. Top panel: intensity response of synthetic Ca imaging data for filters with FWHM of 0.03 nm, 0.22 nm, 0.3 nm and 1 nm, respectively (red/orange/blue/purple lines). Green-dash-dotted line: intensity response for the FALF profile transmitted through a 0.3 nm filter. Black line: intensity response of the 630.25 nm line core. Bottom panel: response for a 0.3 nm filter and the 630.25 nm line core normalized to maximal response (blue/black line), and their difference (red line).
Current usage metrics show cumulative count of Article Views (full-text article views including HTML views, PDF and ePub downloads, according to the available data) and Abstracts Views on Vision4Press platform.
Data correspond to usage on the plateform after 2015. The current usage metrics is available 48-96 hours after online publication and is updated daily on week days.
Initial download of the metrics may take a while.