Fig. 1
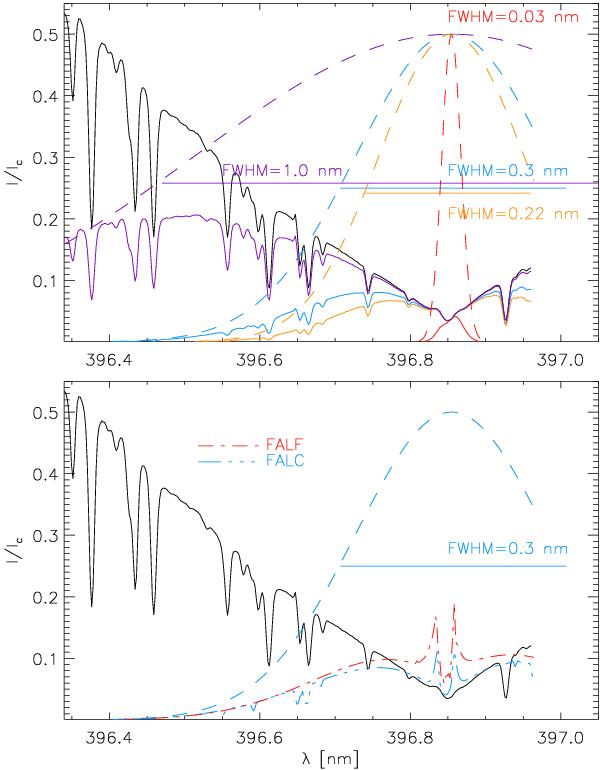
Average observed and theoretical Ca profiles with different filters. Top panel: average observed Ca profile at disc centre (black line). Purple/blue/orange/red dashed lines: Gaussians with FWHM of 1 nm, 0.3 nm, 0.22 nm, and 0.03 nm, respectively, centred at 396.85 nm. Purple/blue/orange/red solid lines: multiplication of the observed profile with the filter transmission. Bottom panel: multiplication of NLTE FALC/FALF profiles (blue-dash-triple-dotted/red-dash-dotted lines) with a 0.3 nm filter.
Current usage metrics show cumulative count of Article Views (full-text article views including HTML views, PDF and ePub downloads, according to the available data) and Abstracts Views on Vision4Press platform.
Data correspond to usage on the plateform after 2015. The current usage metrics is available 48-96 hours after online publication and is updated daily on week days.
Initial download of the metrics may take a while.