Fig. 4
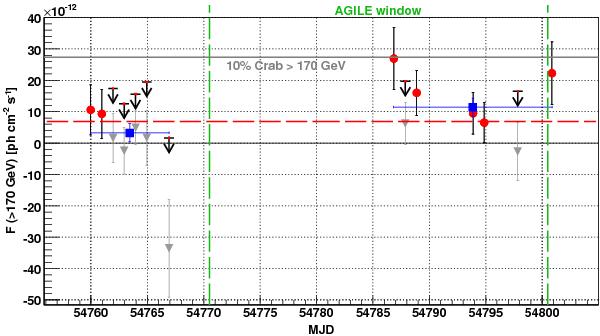
MAGIC light curve of 1ES 2344+514 derived from this campaign. The red points give daily fluxes. For points having a flux consistent with or below zero, shown by the grey triangles, 95% c.l. upper limits were calculated. The red bar on top of each upper limit arrow visualises the bin width. A fit with a constant to all daily flux points is shown by the red dashed line. Additionally, the fluxes for the two observation periods (see also Table A.2) are given as blue full squares.
Current usage metrics show cumulative count of Article Views (full-text article views including HTML views, PDF and ePub downloads, according to the available data) and Abstracts Views on Vision4Press platform.
Data correspond to usage on the plateform after 2015. The current usage metrics is available 48-96 hours after online publication and is updated daily on week days.
Initial download of the metrics may take a while.