Fig. 15
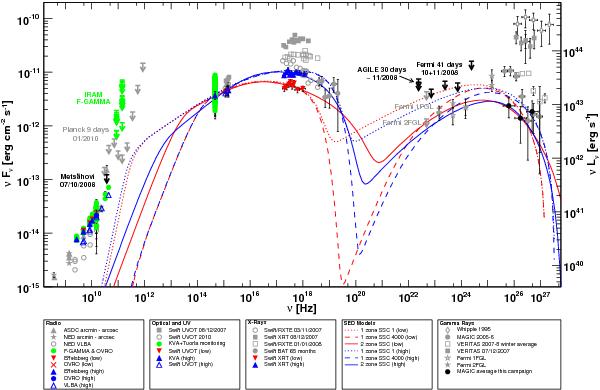
Simultaneous SEDs of 1ES 2344+514 as derived from this campaign (black, blue and red markers) together with monitoring results from F-GAMMA and the Tuorla Blazar Monitoring Program (green points) as well as archival data (shown in grey). The black MAGIC data points represent the overall flux during the campaign. “low” and “high” denote the simultaneous data sets as given in Table 4. For the one-zone model, the number given in the legend represents the value of γmin. See text for further details. Archival data have been taken from the ASDC SED Builder (http://tools.asdc.asi.it), Acciari et al. (2011b), Schroedter et al. (2005) (Whipple) and Albert et al. (2007b) (MAGIC). The Planck ULs were taken from Giommi et al. (2012).
Current usage metrics show cumulative count of Article Views (full-text article views including HTML views, PDF and ePub downloads, according to the available data) and Abstracts Views on Vision4Press platform.
Data correspond to usage on the plateform after 2015. The current usage metrics is available 48-96 hours after online publication and is updated daily on week days.
Initial download of the metrics may take a while.