Fig. 5
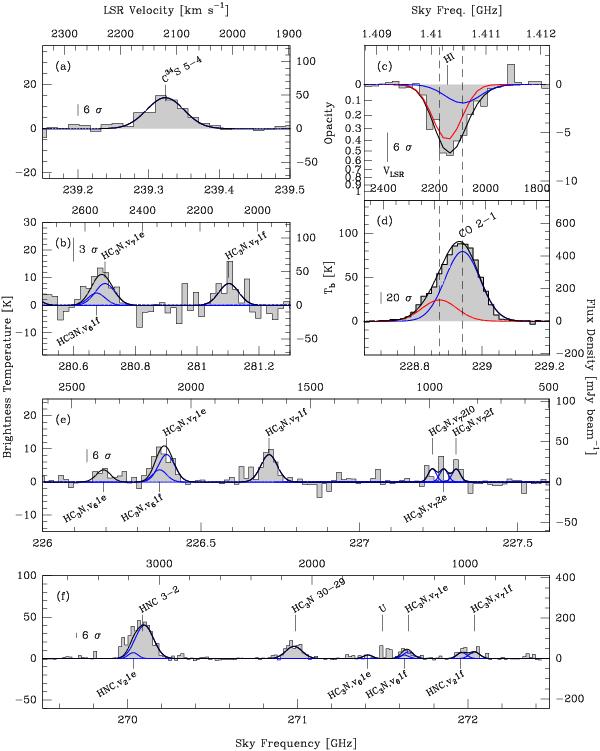
Spectra extracted from the central beam of MERLIN and SMA observations in NGC 4418. The data are drawn as shaded histogram, the solid black line represents the total profile of our LTE best-fit model, and LTE emission from single molecular species is drawn in blue. Panels c) and d) show a comparison of HI and CO 2–1 profiles. Dashed vertical lines mark the velocity centroid of the two components of CO emission, SC at 2090 and RC at 2180 km s-1 LSR (see Sect. 4.1.1). The redshifted Gaussian components (RC), associated with a possible in-flow, are drawn in red in both panels. The conversion between flux density and brightness temperature is discussed in Sect. 4.2.1. The results of the Gaussian fit for each line are shown in Table 3.
Current usage metrics show cumulative count of Article Views (full-text article views including HTML views, PDF and ePub downloads, according to the available data) and Abstracts Views on Vision4Press platform.
Data correspond to usage on the plateform after 2015. The current usage metrics is available 48-96 hours after online publication and is updated daily on week days.
Initial download of the metrics may take a while.