Fig. 9
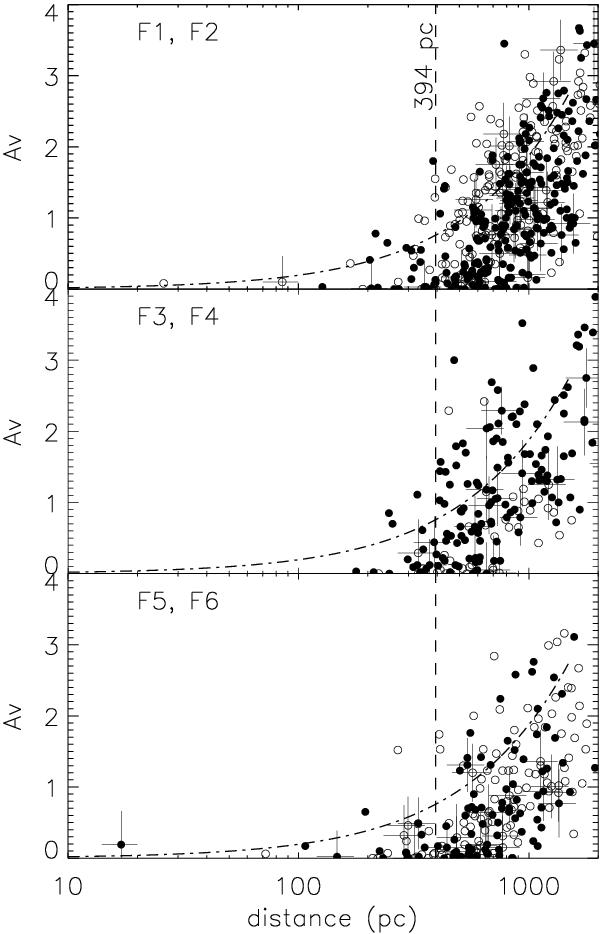
AV vs. d plots for the stars from the fields F1-F6 toward L1570. The stars from the fields F1, F3, and F5 are shown with filled circles and those from F2, F4, and F6 are shown with open circles. The dashed vertical line is drawn at 394 pc inferred from the procedure described in Maheswar et al. (2010). The dash-dotted curve has the same meaning as in Fig. 7.
Current usage metrics show cumulative count of Article Views (full-text article views including HTML views, PDF and ePub downloads, according to the available data) and Abstracts Views on Vision4Press platform.
Data correspond to usage on the plateform after 2015. The current usage metrics is available 48-96 hours after online publication and is updated daily on week days.
Initial download of the metrics may take a while.