Fig. 8
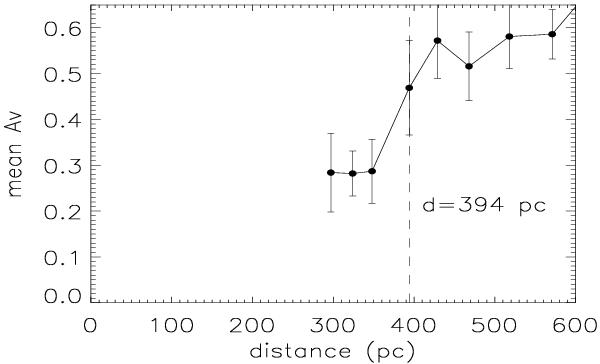
Mean values of AV vs. the mean values of distance plot for L1570 produced using the procedure discussed in Maheswar et al. (2010, see text for a brief description). The distance at which the first sharp increase in the mean value of extinction occur is taken as the distance to the cloud. The error bars on the mean AV values were calculated using the expression  , where N is the number of stars in each bin.
Current usage metrics show cumulative count of Article Views (full-text article views including HTML views, PDF and ePub downloads, according to the available data) and Abstracts Views on Vision4Press platform.
Data correspond to usage on the plateform after 2015. The current usage metrics is available 48-96 hours after online publication and is updated daily on week days.
Initial download of the metrics may take a while.