Fig. 7
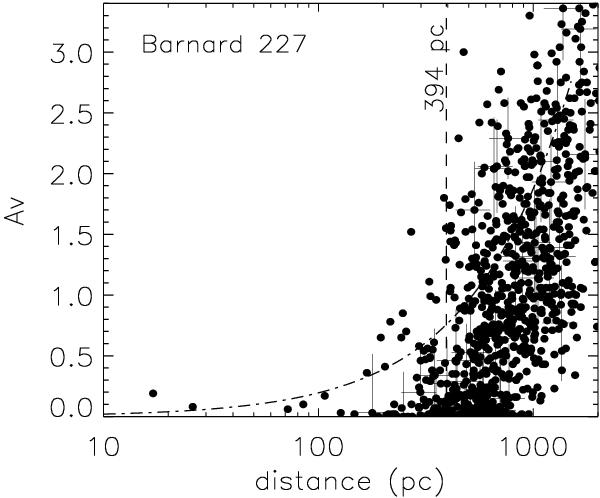
AV vs. d plot for all stars obtained from the fields F1-F6 combined toward L1570. The dashed vertical line is drawn at 394 pc inferred from the procedure described in Maheswar et al. (2010, see the text for a brief description). The dash-dotted curve represents the increase in the extinction toward the Galactic latitude of b = −0.4591° as a function of distance produced from the expressions given in Bahcall & Soneira (1980). The error bars are not shown on all stars for clarity.
Current usage metrics show cumulative count of Article Views (full-text article views including HTML views, PDF and ePub downloads, according to the available data) and Abstracts Views on Vision4Press platform.
Data correspond to usage on the plateform after 2015. The current usage metrics is available 48-96 hours after online publication and is updated daily on week days.
Initial download of the metrics may take a while.