Fig. 11
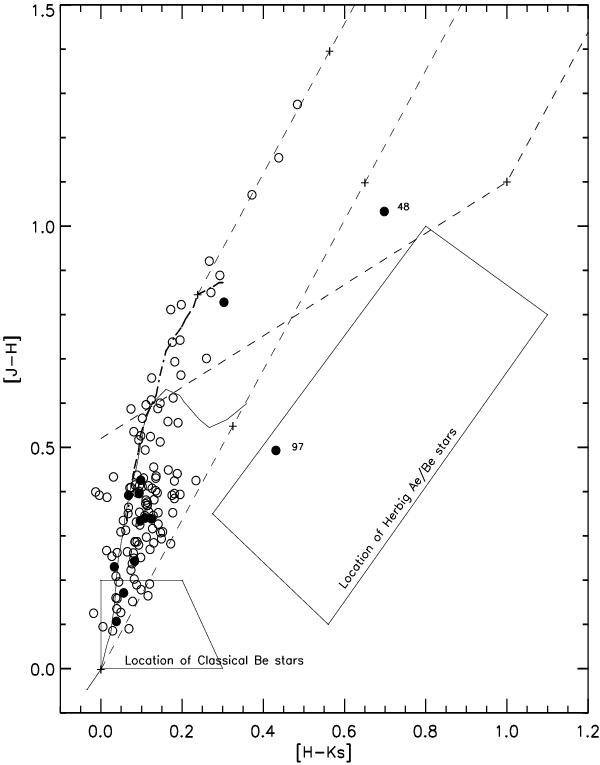
(J − H) vs. (H − K) color–color diagram for all observed 127 stars of L1570 with either single R-band and or with VRI or BVRI data sets. The data are taken from the Cutri et al. (2003) catalog. The 2MASS data have been converted to the California Institute of Technology (CIT) system using the relations provided in Carpenter (2001). The theoretical tracks for dwarfs (thin line) and giants (thick line) are drawn (Bessell & Brett 1988). Reddening vectors (dashed lines) are also drawn (Cohen et al. 1981). The location of Be (cf. Dougherty et al. 1994) and of Herbig Ae/Be (cf. Hernández et al. 2005) stars are also shown. The stars with Hα emission in their spectra (labeled with their unique star id), the stars with probable intrinsic polarization and/or rotation in their polarization angles, and the stars with much lower or higher λmax are shown with filled circles.
Current usage metrics show cumulative count of Article Views (full-text article views including HTML views, PDF and ePub downloads, according to the available data) and Abstracts Views on Vision4Press platform.
Data correspond to usage on the plateform after 2015. The current usage metrics is available 48-96 hours after online publication and is updated daily on week days.
Initial download of the metrics may take a while.