Fig. 10
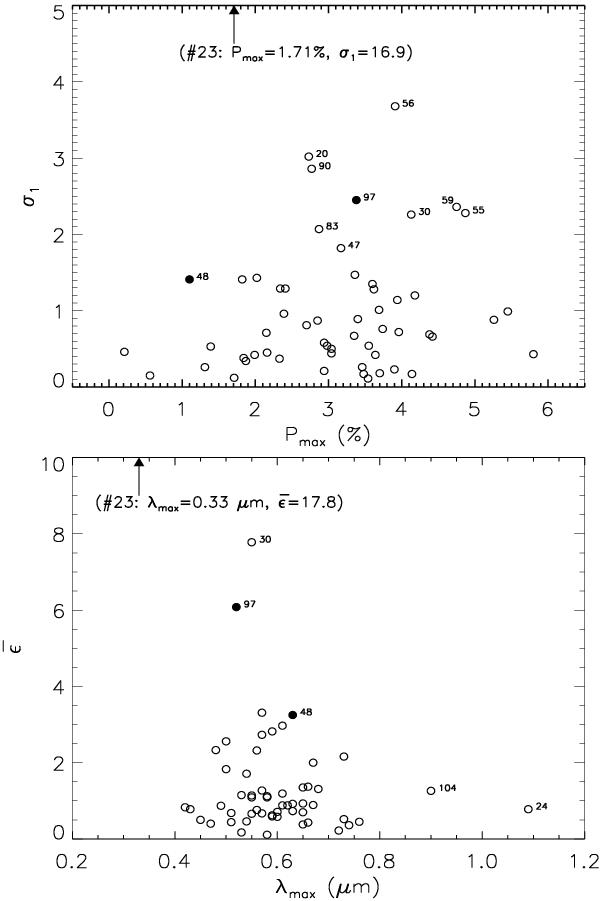
Upper panel: σ1 vs. Pmax and lower panel:  vs. λmax. The stars represented in filled black circles have Hα emission features. The star with σ1> 1.5, ϵ > 4.0 and 0.4 < λmax < 0.90 are identified and labeled with numbers from Table 2. One star (#23) with high values of σ1 and is indicated with an arrow because these values are beyond the plotted range.
Current usage metrics show cumulative count of Article Views (full-text article views including HTML views, PDF and ePub downloads, according to the available data) and Abstracts Views on Vision4Press platform.
Data correspond to usage on the plateform after 2015. The current usage metrics is available 48-96 hours after online publication and is updated daily on week days.
Initial download of the metrics may take a while.