| Issue |
A&A
Volume 556, August 2013
|
|
|---|---|---|
| Article Number | A99 | |
| Number of page(s) | 15 | |
| Section | Extragalactic astronomy | |
| DOI | https://doi.org/10.1051/0004-6361/201220495 | |
| Published online | 02 August 2013 | |
Search for cold and hot gas in the ram pressure stripped Virgo dwarf galaxy IC 3418 ⋆,⋆⋆
1
Astronomical Institute, Academy of Sciences of the Czech
Republic,
Boční II 1401,
141 00
Prague,
Czech Republic
e-mail:
This email address is being protected from spambots. You need JavaScript enabled to view it.
2
Department of Astronomy, Yale University,
260 Whitney Ave., New Haven, CT
06511,
USA
e-mail:
This email address is being protected from spambots. You need JavaScript enabled to view it.
3
Eureka Scientific, 2452 Delmer Street Suite 100,
Oakland,
CA
94602,
USA
e-mail:
This email address is being protected from spambots. You need JavaScript enabled to view it.
4
Observatoire de Paris, LERMA, 61 Av. de l’Observatoire,
75014
Paris,
France
e-mail:
This email address is being protected from spambots. You need JavaScript enabled to view it.
Received:
4
October
2012
Accepted:
30
April
2013
Abstract
We present IRAM 30 m sensitive upper limits on CO emission in the ram pressure stripped dwarf Virgo galaxy IC 3418 and in a few positions covering H ii regions in its prominent 17 kpc UV/Hα gas-stripped tail. In the central few arcseconds of the galaxy, we report a possible marginal detection of about 1 × 10⁶ M⊙ of molecular gas (assuming a Galactic CO-to-H2 conversion factor) that could correspond to a surviving nuclear gas reservoir. We estimate that there is less molecular gas in the main body of IC 3418, by at least a factor of 20, than would be expected from the pre-quenching UV-based star formation rate assuming the typical gas depletion timescale of 2 Gyr. Given the lack of star formation in the main body, we think the H2-deficiency is real, although some of it may also arise from a higher CO-to-H2 factor typical in low-metallicity, low-mass galaxies. The presence of H ii regions in the tail of IC 3418 suggests that there must be some dense gas; however, only upper limits of <1 × 10⁶ M⊙ were found in the three observed points in the outer tail. This yields an upper limit on the molecular gas content of the whole tail <1 × 10⁷ M⊙, which is an amount similar to the estimates from the observed star formation rate over the tail. We also present strong upper limits on the X-ray emission of the stripped gas in IC 3418 from a new Chandra observation. The measured X-ray luminosity of the IC 3418 tail is about 280 times lower than that of ESO 137-001, a spiral galaxy in a more distant cluster with a prominent ram pressure stripped tail. Non-detection of any diffuse X-ray emission in the IC 3418 tail may be due to a low gas content in the tail associated with its advanced evolutionary state and/or due to a rather low thermal pressure of the surrounding intra-cluster medium.
Key words: galaxies: individual: VCC 1217/IC 3418 / galaxies: clusters: individual: Virgo / galaxies: evolution / galaxies: ISM / ISM: kinematics and dynamics / methods: observational
Based on observations carried out with the IRAM 30 m Telescope and with the Chandra X-ray Observatory. IRAM is supported by INSU/CNRS (France), MPG (Germany), and IGN (Spain).
CO spectra as FITS files are available at the CDS via anonymous ftp to cdsarc.u-strasbg.fr (130.79.128.5) or via http://cdsarc.u-strasbg.fr/viz-bin/qcat?J/A+A/556/A99
© ESO, 2013
1. Introduction
The evolution of galaxies in clusters is driven by interactions between the interstellar medium (ISM) of the galaxies and the gas in the intra-cluster medium (ICM; Gunn & Gott 1972; Poggianti et al. 1999; van Gorkom 2004; Koopmann & Kenney 2004). Because of its proximity and dynamical youth (Schindler 1999; Randall et al. 2008), the Virgo Cluster is an excellent laboratory for studying the processes that transform galaxies in dense environments. By far the most numerous galaxies in Virgo are the dwarfs. The relationship between the blue star-forming dwarf irregulars (dIs) and the more common dwarf ellipticals (dEs) has been a long-standing puzzle. Dwarf ellipticals are centrally concentrated in the cluster, whereas blue star-forming dwarf irregulars are preferentially located in the outskirts, although their masses and structural parameters are similar (Binggeli et al. 1987). It has therefore been suggested that dEs might transform from gas-rich dwarf galaxies which lose their interstellar gas and subsequently quench their star formation because of ram pressure stripping (Boselli et al. 2008). Objections to this scenario based on differences in kinematics, metallicity, and nuclei in the dI and dE populations have been largely convincingly addressed by Kormendy & Bender (2012). But until recently there has not been any clear case of a galaxy actually undergoing such a transformation.
The galaxy IC 3418 (VCC 1217) is a peculiar dwarf galaxy located very close to the cluster core, with a projected distance of only 1° (~290 kpc) from M87 (see Fig. 1), and a line-of-sight velocity with respect to the cluster mean of about –1000 km s-1. It is very likely on its first orbit through the Virgo center, and probably close to its nearest approach to M87. No H i was detected anywhere in the galaxy down to a 3σ limit of ~8 × 10⁶ M⊙ per beam (Chung et al. 2009); in the main body of the galaxy there is also no Hα emission (Hester et al. 2010). The stellar metallicity of the galaxy was measured from optical spectroscopy to be ~0.5 ± 0.2 Z⊙ (Kenney et al., in prep.). A new stellar population analysis indicates that star formation in the galaxy stopped about 250 ± 50 Myr ago in the central 25″, and that it took ≲70 Myr for star formation to cease from ~40″ to the center (Kenney et al., in prep.). This is consistent with ram pressure suppression of star formation from the outside inwards, acting typically on a timescale of ~100 Myr. The main stellar body of the galaxy is symmetric and undisturbed indicating that a tidal interaction is excluded (Kenney et al., in prep.).
Parameters of IC 3418 (VCC 1217).
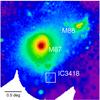 |
Fig. 1 Location of IC 3418 in the Virgo cluster. The background image shows the distribution of the 0.5–2.0 keV ICM as observed in X-rays with ROSAT (Credit: S. L. Snowden, http://heasarc.gsfc.nasa.gov). Silhouette of a GALEX UV image of IC 3418 is displayed at the position of the galaxy. |
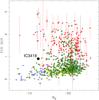 |
Fig. 2 Location of IC 3418 in the (FUV−NUV) − MB color–magnitude diagram of nearby galaxies from the sample of Gil de Paz et al. (2007). FUV−NUV = 0.85 ± 0.10 (Gil de Paz et al. 2007) and mB corrected for internal and Galactic extinction is 14.85 mag (NED), i.e., MB = −16.2. Red dots are elliptical/lenticular galaxies, dark green triangles are early-type spirals, light green triangles are late-type spirals, blue asterisks are irregular and compact galaxies, and black diamonds are galaxies lacking morphological classification. Figure adapted from Gil de Paz et al. (2007). |
A ram pressure stripping scenario for IC 3418 is also suggested by optical and GALEX UV observations (Chung et al. 2009; Hester et al. 2010; Fumagalli et al. 2011) that revealed a remarkable one-sided tail extending 17 kpc from the galaxy’s SE side. It comprises about nine bright knots and linear, parallel filaments of young UV-bright stars. Only in the outer half of the tail Hα + [N ii] emission is found, mostly associated with fireballs (Yoshida et al. 2008), elongated streams of young stars with H ii regions and bright UV knots at their heads (Kenney et al., in prep.). These are interpreted as dense, star-forming gas clouds which are accelerated by ram pressure, leaving behind trails of newly-formed stars that are not affected by ram pressure and therefore decouple from the gas.
While good examples of ram pressure stripping are known among the Virgo spiral galaxies (e.g., Kenney et al. 2004; Chung et al. 2007, 2009; Abramson et al. 2011), none of these galaxies is completely gas stripped and none has such a luminous UV tail, or linear parallel stellar streams, or fireballs as IC 3418. There are already known examples of one-sided tails of young stars extending from more massive galaxies in more distant, richer clusters (Cortese et al. 2007; Yoshida et al. 2008; Smith et al. 2010; Sun et al. 2010; Woudt et al. 2008), where the ram pressure can be 1 to 2 orders of magnitude stronger than in Virgo, but IC 3418 is by far the closest such galaxy known.
In Fig. 2, IC 3418 is placed into a (FUV−NUV) vs. MB color–magnitude diagram of a sample of nearby galaxies studied by Gil de Paz et al. (2007). It shows that IC 3418 stands outside both the red and blue sequences of galaxies, respectively, and that it occurs right at the boundary between early- and late-type galaxies. This suggests that IC 3418 is being transformed from a dwarf irregular type to an early-type galaxy (see Kenney et al., in prep.) which is consistent with the recent cease of its star formation due to ram pressure stripping.
Numerical modeling has shown that ram pressure stripping is a very efficient process for removing the gaseous content of cluster galaxies (e.g., Vollmer et al. 2001; Roediger & Hensler 2005; Jáchym et al. 2007, 2009). Simulations also predict that material in the gas-stripped tails gets compressed by ram pressure and radiative cooling can form new molecular clouds in situ, which might then form a population of new stars (Kapferer et al. 2009; Tonnesen & Bryan 2009). Dwarf galaxies have weaker potential wells and their ambient ISM may be correspondingly less dense (Bolatto et al. 2008). This, plus a strong ram pressure near the cluster center, could significantly enhance stripping of IC 3418 and thus account for its peculiar morphology. The presence of star formation in the tail, strongly suggesting the presence of molecular gas, makes IC 3418 an attractive place to search for CO emission in the environmentally affected galaxy. However, dwarf irregulars are usually fainter in CO than large spirals when normalized by (stellar) mass and those with metallicities less than ~8.0 (in oxygen abundance scale) are challenging to detect (e.g., Taylor et al. 1998; Komugi et al. 2011).
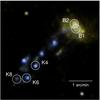 |
Fig. 3 Observed positions on a GALEX image (FUV in blue, NUV in yellow) of IC 3418 with 12CO(1–0) beams (FWHM = 21″) of the 30 m IRAM telescope displayed – two positions (B1, B2) in the main body of the galaxy and three (K4, K6, K8) in the outer part of the tail. The CO(2–1) beams have the same centers but half the diameter as the circles shown – a CO(2–1) beam is shown in B1 with a dashed circle. The background image is adopted from Hester et al. (2010). |
In this paper we want to address two main questions: (1) Is the main body of IC 3418 totally stripped or did some gas survive the stripping? We present the results of our IRAM 30 m search for CO emission since molecular gas is more likely to survive than H i. (2) How does the ISM behave in ram pressure stripped, star-forming tails? We are interested in searching for molecular and for hot X-ray emitting gas in the tail in order to help characterize the ISM in such tails. We present the results of our new sensitive Chandra observation of the galaxy.
The structure of the paper is as follows: after a brief description of our observations (Sect. 2), we present and analyze our IRAM 30 m results (Sect. 3), and estimate upper limits on the current molecular gas content of the whole IC 3418 (Sect. 4). We then estimate the original molecular gas content of the galaxy from the star formation rate (SFR) in the main body and compare the molecular content of IC 3418 with other low-mass galaxies (Sect. 5). The H2-deficiency of the galaxy is also discussed. In Sect. 6 we analyze the Chandra results. Then, by means of numerical calculations we study the effects of ram pressure on ISM with different column density (Sect. 7). In Sect. 8 we discuss the structure of the gas-stripped tail, as well as the fate of the stripped gas, and origin of star formation in the tail. The conclusion follows in Sect. 9.
2. Observations
2.1. Millimeter integration: IRAM 30 m
Using the 30 m telescope operated by the Institut de Radio Astronomie Millimétrique (IRAM) at Pico Veleta, Spain, in August 2011 we carried out observations towards the main body of IC 3418 and the brightest Hα/UV regions of its tail (see scheme in Fig. 3). We used the EMIR receiver in E090 and E230 bands to observe simultaneously at the frequencies of the 12CO(1–0) (νrest = 115.271 GHz) and the 12CO(2–1) (νrest = 230.538 GHz) lines. At these frequencies the telescope half-power beamwidths are 21″ and 11″, respectively, which corresponds to a resolution of about 1.7 kpc and 0.9 kpc, respectively, at the adopted distance of the Virgo cluster of 16.5 Mpc (Mei et al. 2007). As backends, we used the 4 MHz filterbanks at 115 GHz with 10.4 km s-1 velocity resolution, and the WILMA autocorrelator with a spectral resolution of 2 MHz at both 115 GHz and 230 GHz (i.e., 5.2 km s-1 velocity resolution at 115 GHz and 2.6 km s-1 at 230 GHz). The new FTS spectrometer with 0.192 kHz spectral resolution was also connected to both lines as a back-up. In this work, WILMA and 4MHz data are analyzed.
All observations were done in the Wobbler switching mode that is known to provide much flatter baselines, with ripples at a much lower amplitude than with the position switching mode. The secondary reflector was switching symmetrically at 0.7 kHz frequency with 120″ amplitude in azimuth. The actual distance between the source and a reference position is double the amplitude value, i.e., 240″, which is large enough to just avoid the tail with the standard azimuthal direction of switching.
The main beam efficiencies Beff of the 30 m antenna are
estimated to 0.79 at 115 GHz and 0.57 at 230 GHz, and the forward efficiencies
Feff to 0.94 and 0.92, respectively. The corrected antenna
temperatures provided by the telescope were converted to the main beam brightness
temperature by  . To check the
system setup we observed IRC+10216 and M99 and we obtained lines matching the catalogued
lines.
. To check the
system setup we observed IRC+10216 and M99 and we obtained lines matching the catalogued
lines.
Weather conditions were typical for the summer afternoon period at Pico Veleta with the PWV exceeding 10 mm in the first half of the run. Then, after a passage of a weather front, the conditions improved substantially and PWV decreased to 5−7 mm. The atmosphere was, however, rather unstable and pointing and focusing were difficult. Pointing was checked about every 1.5 h mostly on Saturn which was close to our sources, usually with small corrections from 2″ to 5″. The system temperatures are given in Table 2.
List of observed positions.
Properties of the observed positions in IC 3418.
The sky coordinates of the observed positions shown in Fig. 3 are given in Table 2, together with respective on-source times. These were typically 2.5 h per position per polarization, divided into 6 min scans. For the B1 position it was roughly double. For K8, the on-source time was shorter by a factor of ~1.5 than for the K4 and K6, but observing conditions had improved resulting in a better sensitivity. The data were reduced with CLASS (Continuum and Line Analysis Single-dish Software) developed by IRAM in the standard manner: the spectra were checked for errors (spikes) and bad channels exceeding the 5σ level were flagged. The quality of WILMA and 4 MHz data was very good. Linear baselines were fitted. Each spectrum was re-binned to a velocity resolution of 10.4 km s-1 and both polarizations were averaged in order to increase the signal-to-noise ratio (S/N). All scans were then summed up to produce the final spectra. The root mean square (rms) noise levels of about 1−2 mK at CO(1–0) frequency were achieved in the final summed spectra (Table 3).
2.2. X-ray imaging: Chandra
The observation of IC 3418 was performed with the Advanced CCD Imaging Spectrometer (ACIS) on November 12, 2012 (obsID: 13811). Standard Chandra data analysis was performed which includes the corrections for the slow gain change, charge transfer inefficiency, and the ACIS low-energy quantum efficiency degradation from the contamination on the ACIS optical blocking filter. No flares of particle background were present in the observation. The effective exposure time is 33.8 ks for the S3 chip where IC 3418 is positioned. CIAO4.4 was used for the data analysis. The calibration files used correspond to Chandra calibration database 4.5.3 from the Chandra X-ray Center. The solar photospheric abundance table by Anders & Grevesse (1989) were used in the spectral fits. We adopted an absorption column density of 2.2 × 1020 cm-2 from the Leiden/Argentine/Bonn H i survey (Kalberla et al. 2005).
3. Results – IRAM
In a set of deep integrations we observed two positions in the main body of the galaxy where dense molecular gas might have survived the effects of the cluster environment, and three positions in the outer tail where the presence of dense gas is suggested from the existence of H ii regions (Fig. 3, see coordinates in Table 2). The B1 pointing is centered at the galaxy’s optical center (as given by NED), and the B2 point is shifted by less than one CO(1–0) beamwidth in the NE direction, towards the brightest region of the galaxy where significant substructure occurs, indicating that star formation occurred there recently. The tail positions K4, K6, and K81 are associated with peaks in UV and Hα emission.
3.1. Main body
First we searched for CO emission in the central position B1. This was our deepest
integration with the total on-source time of about 5.6 h (per polarization). The left
panels in Fig. 4 show WILMA CO(2–1) and WILMA CO(1–0)
spectra smoothed to 10.4 km s-1 resolution. Very low rms values of about 1.7 mK
and 1.1 mK, respectively, were achieved. Although no strong detection appears, a feature
that is six channels wide (~60 km s-1) occurs at both frequencies at the
central velocity of about 100 km s-1. It is more prominent in the CO(2–1)
spectrum. We inspected the surrounding parts of the spectra and found no other similar
case. The S/Ns of the line feature in the WILMA CO(1–0) and WILMA CO(2–1) spectra are 2.1
and 5.6, respectively, where we have calculated 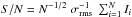 , where
N is the number of channels covered by the line,
σrms is the rms intensity of the spectrum per channel, and
Ii is the brightness temperature in the
ith channel. In order to claim a detection, we require the integrated
intensity
, where
N is the number of channels covered by the line,
σrms is the rms intensity of the spectrum per channel, and
Ii is the brightness temperature in the
ith channel. In order to claim a detection, we require the integrated
intensity  to be at least three times
greater than the noise over the spectral channels covered by the line2.
to be at least three times
greater than the noise over the spectral channels covered by the line2.
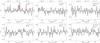 |
Fig. 4 Marginal detection in the central main body position B1 (left), spectra in the off-center position B2 (middle), and combined K4+K6+K8 tail spectra (right): WILMA CO(2–1) (top) and WILMA CO(1–0) (bottom) spectra smoothed to 10.4 km s-1 resolution. Dashed lines show ± 1σ noise levels; y-axis scaling is set to ± 4σ. The velocity scale is LSR; for the sky position of IC 3418, υhelio = υLSR − 3.2 km s-1. |
There is no statistically significant line detection in the CO(1–0) WILMA and 4MHz spectra of the central position, but there are 2.0–2.7-σ features with the same velocity range as the CO(2–1) line. The integrated CO(1–0) intensity measured from the WILMA spectrum is ~0.06 K km s-1 (see Table 3). The CO(1–0) and CO(2–1) features are consistent with a compact CO source which suffers much more beam dilution in the 21″ CO(1–0) beam than the 11″ CO(2–1) beam. With four times the beam area, a point-like source will experience four times the beam dilution in the CO(1–0) beam. The ratio of peak temperatures of ~3 and integrated intensities of ~4 are consistent with the factor of 4 expected from maximum beam dilution multiplied by the typical ICO(2−1)/ICO(1−0) line ratio of 0.8–1 in molecular clouds (e.g., Leroy et al. 2008).
We thus consider the CO(2–1) emission in the center of IC 3418 as marginally detected. In Fig. 4, the CO(2–1) spectral line is fitted with a Gaussian profile with the central velocity of 103 km s-1, FWHM of 54 km s-1, peak brightness temperature of 4.3 mK, and the integrated intensity ICO(2−1) = 0.24 ± 0.05 K km s-1. The central velocity of the line is somewhat smaller than that deduced by Kenney et al. (in prep.) from the stellar Keck spectra (see Table 1). We discuss the velocity difference in Sect. 8.1. Since there is no H i emission in IC 3418, we estimate the maximum rotation velocity from the Tully-Fisher relation (by comparing the H-band luminosity of IC 3418 to other Virgo galaxies with known rotation velocities) to be about 55–60 km s-1. Correcting for an inclination of ~50° (Chung et al. 2009), the expected linewidth is about 50 km s-1, similar to the observed linewidth.
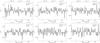 |
Fig. 5 Tail positions K4, K6, and K8: WILMA CO(2–1) (top) and WILMA CO(1–0) (bottom) spectra smoothed to 10.4 km s-1 resolution. Dashed lines show ± 1σ noise levels; y-axis scaling is set to ± 4σ. |
At the adopted Virgo distance of 16.5 Mpc, the main beam projected area at CO(2–1)
frequency is ΩB ≃ 137 arcsec2 = 0.9
kpc2, including a Gaussian beamshape correction factor of
1/ln2. The B1 integrated intensity then corresponds to a luminosity
LCO(2−1) = 2.1 × 10⁵
K km s-1 pc2. The corresponding molecular gas mass can be
calculated using ![Mathematical equation: \hbox{$M_{\rm H_2}\, [M_\odot]= 5.5\, X_{\rm CO}\, \frac{R_{21}}{0.8}\, L_{\rm CO}\, [{\rm K\,km\,s^{-1}\,pc^2}]$}](/articles/aa/full_html/2013/08/aa20495-12/aa20495-12-eq119.png) , where
XCO = NH2/ICO
is the CO(1–0)-to-H2 conversion factor normalized to a standard Galactic value
of 2 × 1020 cm-2 (K km s-1)-1 (e.g., Kennicutt & Evans 2012; Pineda et al. 2010; Feldmann et al.
2012), and R21 is the CO(2–1) to CO(1–0) ratio. We
assume a typical value of R21 = 0.8 (e.g., Leroy et al. 2008). The above formula includes a factor
of 1.36 to account for the effects of helium. The resulting amount of molecular gas
possibly detected in the B1 main body position is
1.2 × 10⁶ M⊙. In Sect. 5.2 we discuss that the X-factor may be (somewhat) larger than the
standard Galactic value because of the sub-solar metallicity of IC 3418.
, where
XCO = NH2/ICO
is the CO(1–0)-to-H2 conversion factor normalized to a standard Galactic value
of 2 × 1020 cm-2 (K km s-1)-1 (e.g., Kennicutt & Evans 2012; Pineda et al. 2010; Feldmann et al.
2012), and R21 is the CO(2–1) to CO(1–0) ratio. We
assume a typical value of R21 = 0.8 (e.g., Leroy et al. 2008). The above formula includes a factor
of 1.36 to account for the effects of helium. The resulting amount of molecular gas
possibly detected in the B1 main body position is
1.2 × 10⁶ M⊙. In Sect. 5.2 we discuss that the X-factor may be (somewhat) larger than the
standard Galactic value because of the sub-solar metallicity of IC 3418.
The size of the emitting region in the B1 pointing is certainly comparable to or smaller than the CO(2–1) beam, i.e., ≲900 pc. This is most likely gas concentrated in the nuclear region. A lower limit on the column density of the central CO-emitting blob is ∝ Mmol/ΩB ~ 1 M⊙ pc-2, assuming a standard Galactic conversion X-factor, if gas uniformly fills the beam. It is, however, much more likely to be concentrated over a smaller area. The actual gas surface density could thus be similar to that of a typical giant molecular cloud (GMC), or ~100 M⊙ pc-2. Also the B1 luminosity of 2.1 × 10⁵ K km s-1 pc2 is comparable to the luminosity of a single giant Galactic molecular cloud. However, the linewidth is much larger than that from a single GMC with Mgas ≃ 106 M⊙ (typically ~10 km s-1) which strongly suggests that emission is not from a single GMC.
In the off-center main body position B2 (about 15″ ~ 1.2 kpc from B1) covering the NE young stellar complex (which is the brightest optical part of the galaxy), no CO emission was detected (see Fig. 4, middle panels). This suggests that molecular gas has possibly survived the effects of the cluster environment only in the very center of the galaxy. In the B2 position, we assume an upper limit on the line width to be about 30 km s-1, i.e., smaller than at B1, as it does not cover the rotation center. Rotation curve studies of Local Volume dwarfs (e.g., Kirby et al. 2012) show that at r = 1 kpc, the rotation velocity is 0.5υmax ~ 30 km s-1. Thus, we derive the upper limits on the integrated CO intensity, CO luminosity, and molecular gas mass, given in Table 3.
3.2. Stripped tail and fireballs
We searched for CO emission in the three points K4, K6, and K8 covering most of the bright H ii regions in the outer tail (see Fig. 3). The positions K4 and K6 show a head-tail (fireball) structure with Hα offset from the UV peaks. We did not observe the brightest UV region (K5 in the notation of Hester et al. 2010) and instead went for the more distant knot K8 that has a higher Hα/UV ratio than K5, suggesting that it may be at an earlier evolutionary stage with more gas. The galaxy IC 3418 is moving toward us with respect to M87 and the stripped material is thus extending away from us: we expect it to be accelerated to larger line-of-sight velocities.
In Fig. 5 we inspect the WILMA spectra for the K4, K6, and K8 regions over a large range, from velocities of the main body to those several hundred km s-1 higher. Although there are few ~3σ features resembling spectral lines, they never occur in the spectra at both frequencies simultaneously, as in the case of B1. As we will show later in Figs. 9 and 10, only low-column density ISM parcels could be accelerated by ram pressure to large vertical velocities. No clear line emission is thus detected in any of the three tail positions. Since the tail linewidths might be broadened by galactic rotation, we will assume linewidths of ~30 km s-1 to derive upper limits on CO intensity in all three tail positions. Table 3 gives corresponding upper limits on ICO, LCO, and Mmol. The upper limits on the molecular gas mass are ~1 × 10⁶ M⊙ per point, assuming a standard Galactic X-factor, but it is possible that in the Hα bright tail regions the CO-to-H2 conversion factor is different from standard value (see discussion in Sect. 5.2).
In order to increase the SNR, we also combined data from the three positions, assuming for a moment that conditions of the molecular gas are similar and that their radial velocities are close; however, no significant signal occurred in the stacked spectrum (see the right panels in Fig. 4). Our achieved upper limits per point on CO luminosity are comparable to the luminosity across most of the SMC, LSMC,CO10 ~ 1 × 10⁵ K km s-1 pc2 as measured by Mizuno et al. (2001). With CO(1–0) point luminosities of ~2 × 10⁵ K km s-1 pc2, we are sensitive enough to detect analogues to the brightest clouds in M33 or the LMC N197 complex.
4. Current molecular gas content
In this section we will estimate from our IRAM observations upper limits on the molecular content in the whole galaxy. We will also calculate an upper limit on the molecular gas mass following from dust observations of IC 3418.
4.1. Current upper limits – the whole galaxy
In Table 4 we give estimates (upper limits) of the CO luminosity and molecular gas mass in the central beam of the main body (the B1 position), the entire main body, the tail, and the whole galaxy (main body plus tail). To estimate the total CO luminosity of the main body of the galaxy from the measured B1 and B2 (upper limit) luminosities, we estimate the filling factor of the CO(2–1) and CO(1–0) beams as the ratio of their area to the optical surface of the galaxy, assuming an exponential distribution of CO emission with a scale length roughly 1.5 times smaller than the optical scale length (Young et al. 1995). Fumagalli et al. (2011) fitted the surface brightness of the IC 3418 disk with an exponential law with a scale length of 19″ ≃ 1.5 kpc. Accounting for the R25 major axis diameter of ~7.2 kpc and the inclination of ~50° (see Table 1), we estimate that the CO(1–0) main beam located in the B1 position would encompass about 25% of the total disk CO luminosity. This yields an estimated upper limit on the molecular gas content in the whole galaxy of about 5 × 10⁶ M⊙. Leroy et al. (2008) suggested that typical dwarfs in a sample of nearby galaxies have molecular gas distributed mostly in their inner (<0.25r25) radius, which matches the CO(1–0) beam radius. Moreover, since the galaxy is probably gas-stripped from the outside in, the expected gas distribution would be more compact than the stellar disk. Thus, it is likely that we are detecting a larger fraction of the total CO flux in the central beam.
Molecular gas mass estimates corresponding to our IRAM detection and upper limits on CO luminosity in the main body and in the tail, assuming a Galactic CO-to-H2 conversion factor.
Applying our 3σ upper limit of Mmol ≲ 1 × 10⁶ M⊙ measured in each of the three tail regions (K4, K6, and K8) to the total number of knots occurring in the wake, an upper limit on the total molecular mass in the tail would be ~9 × 10⁶ M⊙. A similar value comes from calculating the filling factor of the three CO(1–0) beams in the whole tail area. Assuming that the molecular gas occurs (mostly) in the actual places of star formation, and taking into account that all H ii regions are observed only in the outer half of the tail, the upper limit could possibly be lowered to a value similar to the one derived above for the main body. Nevertheless, we conclude that the upper limit on the current molecular gas content of the whole galaxy (main body plus tail) is about 1.5 × 10⁷ M⊙.
4.2. Current molecular gas amount from dust emission
Far infrared (FIR) dust measurements allow an alternative approach for estimating the current molecular gas mass that overcomes some disadvantages of traditional CO line tracers. It traces the total gas column density (H i+H2). In the Small Magellanic Cloud, IRAS observations suggested much more H2 than seen from CO (Israel 1997; Leroy et al. 2007a) and, thus, that CO may be underabundant or absent in regions where H2 survives because the H2 self-shields while the CO is photo-dissociated (e.g., Maloney & Black 1988).
From ISO observations Tuffs et al. (2002) obtained
3σ upper limits on 60 μm, 100 μm, and
170 μm FIR dust emission of IC 3418 of <0.04 Jy, <0.03 Jy,
and <0.07 Jy, respectively. The total dust mass can be determined to within a
factor of 3 from (e.g., Boselli et al. 2002; Evans et al. 2005)
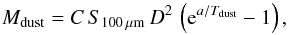 (1)where C
relates to the grain opacity, S100 μm is
the flux in the 100 μm band in Jy, D is the distance of
the galaxy in Mpc, and Tdust is the dust temperature.
According to Boselli et al. (2002), we use
C = 1.27 M⊙ Jy-1 Mpc-2,
Tdust = 20.8 K, and a = 144 K for 100
μm emission. For the
S100 μm < 0.03 Jy
upper limit we get a limit on the dust mass of
≲104 M⊙. Taking a typical cold gas-to-dust ratio
of about 500 (e.g., Lisenfeld & Ferrara
1998), we obtain an upper limit on the molecular gas mass in the galaxy of
≲5 × 10⁶ M⊙. This is a value similar to our CO
luminosity-based upper limit estimate (see Table 4). As we will discuss in the following section, it is likely that molecular gas
has been effectively stripped from IC 3418. This would imply that some dust also has been
removed from the galaxy by ram pressure stripping.
(1)where C
relates to the grain opacity, S100 μm is
the flux in the 100 μm band in Jy, D is the distance of
the galaxy in Mpc, and Tdust is the dust temperature.
According to Boselli et al. (2002), we use
C = 1.27 M⊙ Jy-1 Mpc-2,
Tdust = 20.8 K, and a = 144 K for 100
μm emission. For the
S100 μm < 0.03 Jy
upper limit we get a limit on the dust mass of
≲104 M⊙. Taking a typical cold gas-to-dust ratio
of about 500 (e.g., Lisenfeld & Ferrara
1998), we obtain an upper limit on the molecular gas mass in the galaxy of
≲5 × 10⁶ M⊙. This is a value similar to our CO
luminosity-based upper limit estimate (see Table 4). As we will discuss in the following section, it is likely that molecular gas
has been effectively stripped from IC 3418. This would imply that some dust also has been
removed from the galaxy by ram pressure stripping.
5. Original molecular gas content
We estimate the molecular gas mass Mmol likely to have been in IC 3418 before it was ram pressure stripped from the SFR in the main body. The far-ultraviolet (FUV) emission is a tracer of star formation in the last couple 100 Myr. The FUV luminosity within the 25 mag arcsec-2B-band isophote of the main body of IC 3418 (corrected for Galactic extinction) is LFUV = 1.4 × 1041 erg s-1 (Gil de Paz et al. 2007). The classical SFR-luminosity relation works well for continuous star formation approximation where SFR is constant over the timescale of the UV emission. This is probably not true in IC 3418, where star formation ceased about 200 Myr ago as a result of ram pressure stripping of star-forming ISM, and so the current FUV luminosity is likely scaled down because the stellar population had faded. From evolutionary stellar population modeling we can estimate that FUV flux in a case where star formation ended 100 Myr or 200 Myr ago is reduced by a factor of 8 or 20, respectively, compared to a model with continuous star formation (Hugh Crowl, priv. comm.). This factor could be somewhat lower if ram pressure induced a burst of star formation before quenching it, a phenomenon that was identified in the outer radii of NGC 4522 (Crowl & Kenney 2006), for example. For IC 3418 this is suggested from measuring equivalent widths of the absorption Balmer lines in the spectrum of IC 3418, which are stronger than in post star-burst k+a galaxies (Fumagalli et al. 2011).
As a result, we will apply a factor of ~10 to the SFR of
6.1 × 10⁻³ M⊙ yr-1 determined from the
FUV luminosity–SFR formula of Kennicutt & Evans
(2012) (2)To account for
sub-solar metallicities appropriate for dwarf galaxies, we will also apply to the SFR the
factor of 1/1.1 estimated by Hunter et
al. (2010) from the stellar population evolution models of STARBURST99 (Leitherer et al. 1999) for luminosity at 1500 Å. This
then yields an original SFR of
~5.6 × 10⁻² M⊙ yr-1 in IC 3418, a
value that is consistent with measurements in other dwarf galaxies where SFRs can span
several orders of magnitude (e.g., Hunter et al.
2010; Schruba et al. 2012). Assuming a typical
star formation efficiency in dwarf galaxies of τdep ≈ 2 Gyr
(e.g., Bigiel et al. 2008), this yields about
1 × 10⁸ M⊙ of molecular gas that originally was in
the galaxy. This is about 20 times more than our CO-based upper limit estimate of the
current molecular gas content of the main body.
(2)To account for
sub-solar metallicities appropriate for dwarf galaxies, we will also apply to the SFR the
factor of 1/1.1 estimated by Hunter et
al. (2010) from the stellar population evolution models of STARBURST99 (Leitherer et al. 1999) for luminosity at 1500 Å. This
then yields an original SFR of
~5.6 × 10⁻² M⊙ yr-1 in IC 3418, a
value that is consistent with measurements in other dwarf galaxies where SFRs can span
several orders of magnitude (e.g., Hunter et al.
2010; Schruba et al. 2012). Assuming a typical
star formation efficiency in dwarf galaxies of τdep ≈ 2 Gyr
(e.g., Bigiel et al. 2008), this yields about
1 × 10⁸ M⊙ of molecular gas that originally was in
the galaxy. This is about 20 times more than our CO-based upper limit estimate of the
current molecular gas content of the main body.
Another rough estimate of the original molecular amount can come from the stellar mass of the galaxy and typical fractions of atomic and molecular gas seen in galaxies of the same type. However, this estimate is affected by the issue of the X-factor that we will deal with later. Bothwell et al. (2009) calculated the stellar mass-to-light ratios for different galaxy morphology-color combinations using the algorithm of Bell & de Jong (2001). For Im and dIrr types they derived M/LB = 0.49. For the B-band magnitude mB = 14.85 (see Table 1) of IC 3418 this yields a stellar mass M∗ ≈ 3 × 10⁸ M⊙, which is consistent with the estimate of Fumagalli et al. (2011) (~3.8 × 10⁸ M⊙). It is known that ISMs of dwarf galaxies are dominated by large reservoirs of atomic gas – along the Hubble sequence the H i fraction increases up to typically MH i/M∗ > 0.5 or even >1 in the late types (e.g., Bell & de Jong 2000). The original H i mass of IC 3418 is estimated to ~6 × 10⁸ M⊙ (Gavazzi et al. 2005), which is in agreement with the expected MH i/M∗ > 1. Although dwarf galaxies are H i-rich, molecular gas represents only a small fraction of their total gas mass, typically MH2/MH i ≈ 0.1–0.2 which is similar to the ratio found in the outer parts of spiral galaxies (e.g., Obreschkow & Rawlings 2009; Israel 1997). This corresponds to ~(0.6−1) × 108 M⊙ of original H2 in IC 3418, which is consistent with the above estimate.
5.1. Comparison with other galaxies
We will also compare our results with other galaxies, including low-mass, low-metallicity dwarfs. In Fig. 6, IC 3418 is placed into a plot of normalized CO luminosity LCO/LK vs. LK, together with (a) the sample of Schruba et al. (2012) containing 16 nearby low-mass star-forming HERACLES galaxies as well as some more massive HERACLES galaxies and Local Group galaxies, (b) a subset of the sample of compact late-type spirals and irregulars of Leroy et al. (2005, their detections correspond instead to lower limits because they observed only the central few kpc of each galaxy), (c) a few starburst dwarfs of Taylor et al. (1998) not contained in the Schruba et al. (2012) collection, and (d) DDO154 observed by Komugi et al. (2011).
The normalization LCO/LK used in Fig. 6 should remove most of the galactic mass and size correlations and thus reveal an unbiased state of the CO content of the galaxies. All the K-band magnitudes of the galaxies were taken from NED, as well as their distances (except for the sample of Schruba et al. 2012, for which we used their distances). We preferred to use redshift-independent (mostly Tully-Fisher) distances whenever available. The K-band apparent magnitude of IC 3418 is 12.55 (see Table 1). The CO(2–1) luminosity detected in the B1 position was converted to CO(1–0) scale using ICO21 = 0.7 ICO10, to be consistent with Schruba et al. (2012).
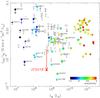 |
Fig. 6 Normalized CO(1–0) luminosity as a function of K-band luminosity. IC 3418 is represented with a red arrow with the head corresponding to the marginally detected (B1) CO luminosity and the upper tail bar to the upper limit for the total luminosity of the disk. IC 3418 is compared with a set of nearby low-mass star-forming galaxies from the HERACLES survey (together with more massive HERACLES galaxies, and other Local Group and nearby galaxies) used by Schruba et al. (2012) (filled circles), and with a sample of compact late-type spiral and irregular galaxies of Leroy et al. (2005) (empty circles), plus few starburst dwarf galaxies from Taylor et al. (1998) (triangles), and DDO154 (Komugi et al. 2011). Upper limits are plotted with symbols with small arrows. Colors represent metallicity 12 + log (O/H). The color of the IC 3418 arrow does not correspond to its metallicity (see Sect. 5.2). Small empty circles show marginal detections of Leroy et al. (2005). |
In Fig. 6 IC 3418 is represented with a red arrow with the head corresponding to the detected (B1) CO luminosity and the upper tail bar to the upper limit for the total luminosity of the disk. When first focusing on the high end of the IC 3418 range, the galaxy occurs in the middle of other galaxies and thus shows no special value of LCO/LK. However, when taking into account only the actual detection in the nuclear region of the disk, IC 3418 shifts to a rather sparsely populated region of the plot where only few galaxies have similar or lower values of the normalized CO luminosities. Although this region may suffer from a lack of observations with CO sensitivity levels similar to ours, this suggests that CO content of IC 3418 is low relative to its other properties. The LCO/LK ratio is systematically lower in galaxies with LK ≲ 1010 L⊙, probably mostly because of a different CO-to-H2 relation connected to their low metallicity. But even among low-mass galaxies of a given metallicity, the CO-to-H2 relationship may vary due to variations in the amount of photo-dissociating UV radiation, which is correlated with the SFR. The other dwarfs with similar or lower values of LCO/LK, notably NGC 1569, NGC 2537, or NGC 5253, are all starburst blue compact dwarfs in which strong photo-dissociation of molecular gas by UV radiation from young stars may make their CO content especially low. In IC 3418, since star formation ended about 100–200 Myr ago, the effects of photo-dissociation are expected to be less extreme.
Thus, the reason for the low LCO/LK ratio of IC 3418 must be different. Since the galaxy clearly has been strongly ram pressure stripped, the removal of molecular or molecular-forming ISM would be a possible explanation.
5.2. CO as a tracer of H2
It has been shown that in dwarf irregular galaxies with metallicities lower than about 1/10 of solar, i.e., 12 + log (O/H) ≤ 8.0, the detection of CO emission steeply decreases (e.g., Taylor et al. 1998; Leroy et al. 2007b; Komugi et al. 2011; Schruba et al. 2012), although ionized carbon and the ratio of IR to millimeter dust emission around star-forming regions indicate that molecular gas is still present. Applying a Galactic CO-to-H2 conversion ratio then results in very low molecular gas masses and about 10–100 times higher star formation efficiencies (SFEs). It is, however, more likely that the true SFEs of dwarfs are normal, and the CO-to-H2 factor is systematically different. Thus, assuming a constant H2 depletion time of τdep = 1.8 Gyr, Schruba et al. (2012) derived for dwarf galaxies with metallicities 1/2–1/10 Z⊙ conversion factors more than one order of magnitude larger than in massive spirals with solar metallicities.
Using evolutionary models for Lick indices in Keck spectroscopic data, stellar metallicity that represents an average over the star formation history in IC 3418 is estimated to 0.5 ± 0.2 solar, i.e., 12 + log (O/H) ~ 8.4 (Kenney et al., in prep.)3. Another estimate comes from the stellar mass-metallicity relation (Tremonti et al. 2004; Kewley & Ellison 2008; Pettini & Pagel 2004): for the IC 3418 stellar mass of ~3 × 10⁸ M⊙, the predicted stellar metallicity is 12 + log (O/H) ~ 8.3, i.e., ~0.4 solar. Unfortunately, there is no data available on the gas metallicity of IC 3418 that would reveal the actual amount of metals currently present in the ISM. Nevertheless, in IC 3418 we expect the CO-to-H2 conversion factor to be larger than Galactic because of the decreased dust shielding at a presumably low metallicity in the galaxy. From Eq. (5) of Leroy et al. (2013)4 the correction to the standard CO-to-H2 conversion factor can be estimated to ~5. However, this estimate remains highly uncertain.
5.3. H2-deficiency?
While many Virgo cluster spirals are highly H i-deficient (e.g., Kenney et al. 2004; Chung et al. 2007, 2009; Abramson et al. 2011), their molecular gas content is relatively normal or only slightly deficient (e.g., Kenney & Young 1986, 1989). This is largely a difference between the inner H2-dominated, and outer H i-dominated disks. In galaxies which are clearly ram pressure stripped, nearly all the gas, including molecular gas, and dust beyond some gas truncation radius is gone (Vollmer et al. 2012; Cortese et al. 2010). While decoupled molecular clouds have been observed beyond the main gas truncation radius in some galaxies (NGC 4402, NGC 4522, NGC 4438; Crowl et al. 2005; Vollmer et al. 2008; Vollmer 2009, respectively), the mass in such features is small and they apparently do not survive long. Thus, ram pressure stripped spirals in Virgo must be somewhat H2-deficient5.
The IC 3418 galaxy is highly H i-deficient, with the deficiency parameter defH i = log (MH i,orig/MH i, obs) ≳ 2.16 (Chung et al. 2009; Gavazzi et al. 2005). The above estimated original amount of molecular gas in the galaxy of ~1 × 10⁸ M⊙ in comparison with our CO-based upper limit of 5 × 10⁶ M⊙ indicates that IC 3418 could also be poorer in molecular gas by a factor of 20 (i.e., defH2 = log (MH2,orig/MH2, obs) ~ 1.3). The H2-deficiency is generally small in Virgo spirals since ram pressure is not strong enough to strip massive galaxies deeply. However, lower mass galaxies with shallower potential wells are expected to be more completely stripped in Virgo, and are expected to be significantly H2-deficient; IC 3418 may be such a galaxy. While we cannot presently determine how much of the weakness in CO emission is due to H2-deficiency vs. a non-standard CO-to-H2 relation, the lack of ongoing star formation in IC 3418 strongly suggests the galaxy is deficient in molecular gas.
6. Results – Chandra
No diffuse X-ray emission is detected from IC 3418 and its tail. There is also no detection of a shock front ahead of IC 3418. The Chandra data show three point sources in the tail region, which will be discussed elsewhere. In this paper, we focus on the limit of the X-ray emitting gas in the tail region (3.5′ × 1′, or 16.8 kpc × 4.8 kpc). A 3σ upper limit on the X-ray enhancement over the Virgo ICM background emission at the tail region is derived from the 0.5–2 keV image. A spectral model of the X-ray tail is required to convert the count rate limit to the flux limit and the mass limit. The X-ray tail is expected to have multiple temperature components. However, low statistics of X-ray tails so far have hindered a detailed study, so often a single temperature component is assumed (see detailed discussions in Sun et al. 2010). The known X-ray tails have TICM/Ttail ratios of 3–8 (Sun & Vikhlinin 2005; Sun et al. 2010; Weżgowiec et al. 2011). If we simply take this range for the ratio, the expected tail temperature of IC 3418 is 0.3–0.8 keV, for a surrounding ICM temperature of ~2.5 keV (Shibata et al. 2001). In this work, we assume a single APEC model with temperatures of 0.3–0.7 keV and abundances of 0.1 solar or 1 solar (see Table 5). The assumed X-ray tail is approximated by a cylinder 16.8 kpc long with a diameter of 4.8 kpc. The derived upper limits are listed in Table 5. While it is often assumed that the stripped ISM is metal rich, a one-T fit always results in very low abundance, which is presumably caused by the mixing of multi-T gas in the tail (see discussions in Sun et al. 2010).
Upper limits on the X-ray emission from the IC 3418 tail.
As shown in Table 5, the derived 0.5–2 keV
luminosity limit is ~280 times and ~100 times lower than the luminosities of ESO 137-001
and ESO 137-002, respectively, the spiral galaxies in a more distant cluster with prominent
ram pressure stripped tails with strong X-ray emission (Sun
et al. 2010). The X-ray mass limit is less than
 , where
fX is the filling factor of the X-ray emitting gas in the
tail. If the X-ray tail in IC 3418 is cooler than the 0.3 keV assumed in our spectral model,
the mass and bolometric luminosity limits would become weaker.
, where
fX is the filling factor of the X-ray emitting gas in the
tail. If the X-ray tail in IC 3418 is cooler than the 0.3 keV assumed in our spectral model,
the mass and bolometric luminosity limits would become weaker.
In numerical simulations the amount of X-ray emitting gas in the tail was found to depend strongly on the surrounding ICM pressure (Tonnesen et al. 2011). The thermal pressure of the ICM at the location of IC 3418 in Virgo is PICM = nICMT ~ 2.8 × 10⁻¹² dyne cm-2, where nICM = 7.1 × 10⁻⁴ cm-3 is the local ICM density (see Sect. 7 for details), and kBT = 2.5 keV is the local ICM temperature (Shibata et al. 2001). The simulation run of Tonnesen & Bryan (2010) with a close ICM thermal pressure value of 1.76 × 10⁻¹² dyne cm-2 suggests that some soft (0.5–2 keV) X-ray emission could be observable in the tail of IC 3418 for our sensitive Chandra surface brightness limit of ~4 × 10⁻⁷ erg s-1 cm-2. This follows from Fig. 2 (right panel) in Tonnesen et al. (2011), assuming the same column density of about 1020 cm-2 for the hot gas in the tail of IC 3418 as is measured in the simulations. However, the gas mass and gas density in the tail are expected to strongly evolve over time, and Tonnesen & Bryan (2010) did not study the evolutionary stage after the galaxy is fully stripped, like in IC 3418.
Once the main body of the galaxy has been (nearly) completely stripped, the source of new tail gas is depleted. In one of the simulations of Kapferer et al. (2009), who use a different numerical hydrodynamics scheme than does Tonnesen (smoothed particle hydrodynamics, SPH, vs. adaptive mesh refinement, AMR), a model massive galaxy is completely stripped by a strong ram pressure. Some 400 Myr after the galaxy was stripped, there is still a very long bright X-ray tail that is spatially coincident with a star-forming tail. However, IC 3418 is a small galaxy, originally with a much smaller amount of gas. Thus, after the main body has been nearly completely stripped, the gas density of the tail is expected to drop. It is possible that the X-ray tail lags farther behind the SF tail which is the case in ESO 137-001, for example, where the brightest X-ray region is 35 kpc from the galaxy. However, the Chandra field of view covers another ~2.2′ after the end of the SF tail, with no sign of the X-ray enhancement. The X-ray surface brightness is about the same, so the flux limit would be ~28% higher if a region of 5.7′ × 1′ is considered (instead of 3.5′ × 1′).
Thus, one reason for the weak X-ray (as well as Hα and H i) emission in the tail of IC 3418 could be that it is in an advanced evolutionary stage when the gas density of the tail is expected to drop. In the Virgo cluster, however, almost no X-ray tails are observed in other ram pressure stripped galaxies with H i or Hα tails. The possible reasons for our non-detection thus further include low pressure of the surrounding ICM (for comparison, the ICM thermal pressure at the position of ESO 137-001 in the A3627 cluster is about 1.8 × 10⁻¹¹ dyne cm-2, i.e., about six times higher than in Virgo at the position of IC 3418) or a lower tail temperature than we assumed in the spectral model, which would also mean fast cooling (assuming a not-very-small abundance) and thus a short lifetime.
7. Ram pressure stripping
Ram pressure stripping is very likely the principal cause of the strong gas deficiency of IC 3418 and of its peculiar morphology (Hester et al. 2010; Fumagalli et al. 2011). Acceleration due to ram pressure basically depends on the column density of the gas parcels and the gravitational potential of the galaxy. The shallow potential of the dwarf makes its interstellar matter more susceptible to ram pressure and so material with higher column density can be affected. Compared to other ram pressure stripped galaxies in the Virgo cluster, IC 3418 is also projected closer to the cluster center where the ICM density is higher. Although we don’t know the true de-projected distance, IC 3418 is probably affected by a stronger ram pressure than other Virgo galaxies.
In this section we use semi-analytic calculations to model the effects of a time-varying ram pressure on both atomic and molecular ISM components in a simple manner by taking into account their column density as a critical parameter. In a static potential of a two-component model of the galaxy consisting of the disk and halo (the contribution of a bulge is neglected), we follow dynamics of ISM parcels at different disk radii under the influence of an external time-varying face-on force. Every parcel is assigned a column density. For every parcel we calculate the equation of motion in the vertical direction that takes into account local ram pressure and the restoring force from the galaxy. The local ram pressure may be expressed as dυ/dt = −ρICM |υ − υ0|2/ΣISM, where ΣISM is the mean column density of an ISM parcel and (υ − υ0) is the vertical component of its relative velocity with respect to the surrounding hot gas. The galaxy is modeled with a Miyamoto-Nagai disk and a Plummer halo (e.g., Binney & Tremaine 2008) with the parameters specified in Table 6.
Parameters of galaxy and cluster models used for semi-analytic calculations of ram pressure stripping.
At the projected distance of IC 3418 from M87 of about 1°, the density of the ICM is ~7.1 × 10⁻⁴ cm-3, assuming a spherically symmetric and smooth distribution fitted with a double β-profile (Matsushita et al. 2002). The parameters used are given in Table 6. We get an upper limit on the local ram pressure of about 1820 cm-3 (km s-1)2 = 1.8 × 10⁻¹¹ dyne cm-2, assuming a deprojected orbital velocity of 1600 km s-1 for IC 3418. The time evolution of the ram pressure exerted on the disk corresponds to a profile along an orbit of IC 3418 that is consistent with its observed plane of the sky position with respect to the Virgo cluster center and line-of-sight velocity. The projected tail direction was assumed to indicate the current direction of motion in the plane of the sky. We have studied orbits with peri- to apocenter ratios from about 1:5 to 1:20 that are characteristic for radial orbits in galaxy clusters (Ghigna et al. 1998; Boselli & Gavazzi 2006; Vollmer 2009). As a fiducial orbit we have chosen an orbit that brings IC 3418 currently almost to pericenter, about 275 kpc from the cluster center, with the plane of the sky velocity components υx = υy = 820 km s-1. The total 3D velocity is thus ~1600 km s-1. The gravitational potential of the Virgo cluster was approximated by the spherically symmetric potential of the NFW dark matter halo (Navarro et al. 1996) with parameters specified in Table 6.
In Figs. 7 and 8, the vertical distance behind the disk to which parcels with different column densities occurring at different radii (up to 5 kpc; the R25 major axis radius of IC 3418 is ~3.6 kpc; see Table 1) can get in our model are shown for two time moments along the ram pressure event: 100 Myr before the peak and 100 Myr after the peak. In the pre-peak situation, only parcels with ΣISM < 15 M⊙ pc-2 can be shifted (not necessarily stripped) to at least 20 kpc, i.e., to distances comparable to the projected length of the tail of IC 3418. From the nucleus of the galaxy, parcels with ΣISM ≈ 5−10 M⊙ pc-2 can get to such distances. In the post-peak situation, more material is accelerated to larger distances – parcels from outer disk radii with ΣISM up to about 35 M⊙ pc-2, and from inner radii with ΣISM < 15 M⊙ pc-2, can get to z ~ 20 kpc.
Figures 7 and 8 thus suggest that in our simulation low-density (H i-like) gas is stripped from the galaxy quite easily and can get to large distances; in the post-peak situation, all the gas with ΣISM ≲ 5 M⊙ pc-2 gets to z > 100 kpc. Between the inner and outer radii, there is a large difference in the column density of parcels that can be moved to a certain distance. Denser gas parcels are thus difficult to strip substantially.
Figures 9 and 10 depict the vertical velocities relative to the galaxy to which ISM elements can be accelerated depending on their column density, for both the pre-peak and post-peak stages. Only low-density stripped parcels can reach high velocities in the pre-peak phase and the situation does not change much in the post-peak phase where elements with column densities <15 M⊙ pc-2 can occur at about 400 km s-1 relative to the galaxy. This excludes the possibility that some weak features noted in the spectra of the K4 and K6 tail positions in Sect. 3.2 may correspond to a real CO emission.
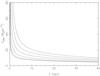 |
Fig. 7 Pre-peak stripping: vertical distances that ISM elements can reach with different column densities from radii 0–5 kpc (with 1 kpc step; from left to right) in our model 100 Myr before the peak ram pressure. |
In Fig. 11 we show the time evolution of the stripping radii of ISM parcels with different column densities. The stripping radius of a disk gas component with some ΣISM corresponds to a radius outside which it is released from the galaxy’s potential (Etot = Ekin + Epot > 0). Figure 11 provides a timescale for the stripping along our fiducial orbit: H i-like parcels (modeled with a Miyamoto-Nagai profile with Σ0 = 10 M⊙ pc-2 that yields ΣR = 5 kpc = 0.3 M⊙ pc-2) start to be released from the outer disk by a weak ram pressure at cluster outskirts. It takes about 1 Gyr before they are removed completely from R = 3 kpc to the center of the galaxy. Denser gas parcels, with ΣISM up to ~20 M⊙ pc-2, can also be stripped throughout the disk. This happens on shorter timescales of 100−200 Myr from R = 3 kpc to 0 kpc as higher ram pressure arising only closer to the pericenter is required. For yet higher values of the column density the stripping radius starts to increase and subsequently approaches the outer disk radius. This happens at ΣISM ~ 50 M⊙ pc-2 which suggests that parcels with densities at this or a higher level can never be stripped from the galaxy by ram pressure alone.
Our simulation results are consistent with the results of spectral modeling of observations which suggested that star formation in the main body of IC 3418 stopped about 200–300 Myr ago, on a timescale of less than ~70 Myr from the outside in (Kenney et al., in prep.). Some of the denser gas in Fig. 11 is released only after maximum ram pressure, but this is part of material that had already been pushed out of the disk plane to the halo region, and will eventually fall back to the disk (see Jáchym et al. 2009, for details). Although our calculations depend on the adopted values of the free orbital parameters not constrained by observations and on the total mass of the galaxy, the results are consistent with what is expected from other simulations and existing observations of galaxies in clusters of the size of Virgo (Kenney & Young 1989; Boselli et al. 2002; Fumagalli & Gavazzi 2008): it is not possible to directly strip the dense (molecular) clouds, so they must have been removed from IC 3418 in some other way that we will discuss later.
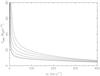 |
Fig. 9 Pre-peak stripping: vertical velocities to which ISM elements can be accelerated with different column densities from radii 0–5 kpc (with 1 kpc step; from left to right) in our model 100 Myr before the peak ram pressure. |
8. Discussion
8.1. Central bulk of molecular gas
If our marginal detection of CO emission in the B1 pointing is real, it corresponds to gas concentrated in the nuclear region. The possible survival of dense gas in the galaxy core (central few arcseconds = few hundred pc) could either be because it is the center of the galaxy, the deepest part of the potential well from which it is most difficult to remove gas, or because the surface density of molecular gas is higher than the rest of the ISM, or both. While some molecular gas in the nucleus has apparently survived the stripping, there is no ongoing star formation in this gas. This might be due to a gas density that is below a threshold needed for star formation. The detected gas survived ~200 Myr after the cessation of star formation (Kenney et al., in prep.) that is presumably due to removal of most of the ISM.
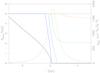 |
Fig. 11 Time evolution of stripping radii of ISM parcels with different column densities: H i-like (radius-dependent Miyamoto-Nagai profile with Σ0 = 10 M⊙ pc-2 which yields ΣR = 5 kpc = 0.3 M⊙ pc-2), and constant ΣISM = 10, 15, 25, and 50 M⊙ pc-2 (from left to right) in our model. Ram pressure time profile along our model orbit is shown with the dashed line. |
The survival of molecular gas in the very central region of an otherwise gas-stripped dwarf irregular galaxy could be relevant for the formation of nucleated dwarf elliptical galaxies. Many cluster dEs have distinct nuclear star clusters, and it is not understood why some dEs have them and others do not. A surviving central gas reservoir may make it possible to form a nuclear star cluster even after the galaxy is mostly gas-stripped. Also, as shown in numerical simulations, high-density clouds may lose angular momentum through interaction with the ICM and drift toward the center of the galaxy (Tonnesen & Bryan 2009).
The heliocentric central velocity of the marginally detected central CO line is about 100 km s-1 (see Sect. 3.1). From Keck spectra, Kenney et al. (in prep.) measured a value of 170 ± 10 km s-1 for the central velocity of the stars in the galaxy. The galaxy’s rotation is presumably too small to account for such a velocity difference. Moreover, acceleration due to ram pressure would push the gas toward a higher radial velocity. On the other hand, if dense gas clouds can fall back into the galaxy after they condense in the tail and then become decoupled from ram pressure, they would have blue-shifted radial velocities relative to the central stellar disk. This behavior was noted in ram pressure stripping simulations of Kapferer et al. (2009) and could work in IC 3418. Future more sensitive CO observations could resolve the origin of the observed mismatch between the velocities of the stellar and molecular components.
8.2. Molecular gas and star formation in the tail
To assess the current molecular content of the tail of IC 3418, we inquire how much molecular gas is needed for the amount of star formation in the tail observed. Using the definition of GALEX AB magnitudes6, the total FUV luminosity of the tail is about 3.6 × 1025 erg s-1 Hz-1 (Fumagalli et al. 2011). Making the assumption of a continuous star formation over the last ~100 Myr, Eq. (2) predicts a SFR of ~3.4 × 10⁻³ M⊙ yr-1. The total Hα luminosity of the knots in the outer half of the tail of about 2.4 × 1038 erg s-1 (Fumagalli et al. 2011) corresponds to a SFR of ~1.3 × 10⁻³ M⊙ yr-1 over the last ~10 Myr (Kennicutt & Evans 2012)7. The difference in SFR estimates is not large and may be mainly because Hα emission is restricted to the outer part of the tail. Adopting a SFR in the tail of ~3 × 10⁻³ M⊙ yr-1, and assuming a typical star formation timescale (or star formation efficiency SFE(H2) = ΣSFR/ΣH2) of ~2 Gyr (e.g., Bigiel et al. 2008; Leroy et al. 2013) we can deduce the mass of molecular gas expected to be occurring in the tail to be 6 × 10⁶ M⊙. Our observed (3σ) upper limit on CO amount in the tail (see Table 4) is thus consistent with that predicted for a normal gas depletion timescale and normal X-factor. We would need more sensitive CO observations to show that either of these was non-standard.
Star formation rates in the observed tail regions and corresponding lower limits on local CO-to-H2 conversion factor.
Table 7 summarizes FUV and Hα luminosities for the main body and the three tail regions that we observed in CO, and compares the corresponding SFRs. It shows that SFR estimates from the two tracers are in the knots similar, suggesting that indeed the difference in these quantities for the whole tail is because star formation stopped in parts of the tail. Applying our upper limit CO luminosities in the observed regions, we can estimate from the Hα SFRs lower limit values on the CO-to-H2 conversion factor α = τdep × SFR/LCO, assuming a constant depletion time τdep = 2 Gyr. The resulting limits are consistent with the Galactic value αCO ~ 4.4 M⊙ pc-2 (K km s-1)-1. Vollmer et al. (2012) and Boissier et al. (2012) determined that the star formation efficiency in the gas stripped tails of Virgo galaxies with respect to the available amount of atomic gas was at least 10 times lower than within the galaxies. However, Vollmer et al. (2012) found normal values of the SFE with respect to molecular content in the extraplanar regions of the galaxies.
8.3. Where is the gas?
Although dwarf galaxies are gas-rich systems, in IC 3418 practically no gas, neither atomic H i nor molecular H2, is observed. No H i is detected in the body and the tail, with fairly sensitive upper limits, MH i < 8 × 10⁶ M⊙ (Chung et al. 2009). This is ~1% of the H i mass expected in a typical late type dwarf galaxy with the optical size or H-band luminosity of IC 3418. We have possibly found only a small amount of molecular gas MH2 ≃ 106 M⊙ in the central 11″ of the main body, and only upper limits (MH2 < 107 M⊙ assuming standard CO-to-H2 conversion) outside the central region and in the tail. While our upper limits are not sensitive enough to clearly demonstrate a lack of molecular gas in the tail (see Sect. 8.2), there is very likely a large amount of molecular gas missing in the main body. Although this is consistent with the observed absence of any ongoing star formation in the body of the galaxy, the question arises of what happened to the molecular gas that once occurred in IC 3418.
Calculations in the previous section have shown that low-density (atomic) gas can easily be completely stripped by ram pressure from a model of IC 3418, which is consistent with the sensitive non-detection of any H i emission. Higher-density gas with ΣISM up to ~50 M⊙ pc-2 then can be accelerated from outer radii only, while the densest (molecular) gas stays bound to the galaxy. However, stripping by dynamical pressure of the ICM is probably enhanced by other processes such as ablation of dense clouds disrupted by hydrodynamic instabilities (e.g., Quilis et al. 2000; Kapferer et al. 2009; Tonnesen & Bryan 2009), or shock-heating and dissociation of molecular clouds due to supersonic motion of IC 3418 through the Virgo ICM (e.g., Guillard et al. 2012). Moreover, the structure of the ISM in dwarf irregulars can be significantly influenced by stellar feedback and often contains up to ~kpc-scale shells and holes seen in H i (see, e.g., Zhang et al. 2012, and references therein), which could facilitate stripping of the ISM as was shown in numerical simulations of Quilis et al. (2000) with holey disks. Thanks to a shallow potential well and low stellar surface densities, the ISM in dwarfs can also have lower average surface densities than in large spirals. Besides these indirect processes, a very important effect may also come from the rather limited lifetimes of dense clouds (<100 Myr) that are comparable to the typical timescales of ram pressure stripping. The molecular gas reservoir could not then be replenished by further condensation and molecularization of H i since that was removed from the galaxy. All these processes, when combined together, may have resulted in effective stripping of molecular ISM in IC 3418. As a result, IC 3418 may currently be virtually deficient of almost all gas except possibly in its very center.
8.4. Gas phases in the tail
Upper limit (3σ) masses (in M⊙) of gas components issued from different observations of the tail.
Table 8 summarizes the upper limits on the amount
of different gas phases observed in the tail. Once stripped, the gas has probably been
heated to temperatures between that of H i and the ICM, as cooler gas in the tail
mixes with hot ICM gas, or more dense gas has been condensing into star-forming clouds.
The absence of bright X-ray emission (see Sect. 6)
is likely because of a low gas content in the tail associated with its advanced
evolutionary state and/or because of rather low thermal pressure of the ICM at the
position of IC 3418 in the Virgo cluster. Compression of stripped gas by the surrounding
ICM determines the temperature and density distribution of gas in the tail. If present,
the hot gas component in the tail is thus probably too diffuse to be observable in X-rays.
The actual upper limit mass is close to
~4 × 10⁷ M⊙ since the filling factor of the
X-ray emitting gas is not expected to be much smaller than 1. Associated with the H ii
regions, there is clearly ionized gas in the tail, but it is difficult to reliably
estimate its mass without knowing the gas density; however the ionized gas mass in
H ii regions is generally small. While no diffuse Hα emission
has been detected, there could be significant mass associated with undetected diffuse
104 K gas. We derive the upper mass limit on Hα emitting
diffuse gas from the 2σ limit of the Hα surface
brightness of 1.36 × 10⁻¹⁷
erg s-1 cm-2 arcsec-2 observed with WIYN 3.5 m
telescope (Kenney et al., in prep.). This is ~2.3 times more sensitive than the
Hα image presented by Fumagalli et al.
(2011). If the Hα emission is considered to originate from the
same cylindrical volume of the X-ray gas, assuming an electron temperature of
104 K and case B of nebular theory, the mass limit of the
Hα-emitting gas is  , where
fHα is the filling factor of the Hα gas.
Numerical simulations of ram pressure stripping indicated that bright Hα
emission is produced at the edges of dense neutral clouds (Tonnesen et al. 2011), so the volume filling factor should be low. From
numerical simulations of Tonnesen et al. (2011)
with the value of ICM thermal pressure consistent with that for ESO 137-001 (their Fig. 2,
left panel), it follows that the typical local density of the Hα gas in
the ESO 137-001 tail is ~1 cm-3. Since the rms electron density observed in
the tail of ESO 137-001 is ~0.045 cm-3 (Sun et
al. 2007), the filling factor, defined as the ratio of the average density and
local density, is estimated to be about 5 × 10⁻². Thus, a reasonable upper
limit on the amount of Hα emitting gas in the tail of IC 3418 would be
about 6 × 10⁷ M⊙. Considering the atomic component
of the gas in the tail, the mass upper limit is
~4 × 10⁸ M⊙ following from the upper limit of
8 × 10⁶ M⊙ per beam
(FWHM ~ 16″, Chung et al. 2009),
and assuming the same tail dimensions used above for the X-ray mass estimate (see Sect.
6). The actual amount of the H i in the
tail may be much lower than the limit since denser clouds have probably condensed into
stars while the diffuse gas had been stripped to large distances (very likely exceeding
the observed length of the tail), as follows from the calculations in Sect. 7. Numerical simulations of Tonnesen et al. (2011) suggest that in the rather low thermal pressure
environment surrounding IC 3418, the mass fractions of cool
(300 K < T < 104
K) and hot
(7 × 10⁵ K < T < 4 × 10⁷
K) components in the stripped gas might be both of about 30% of the total stripped mass
without much evolution as the tail ages from 100 Myr to 250 Myr.
, where
fHα is the filling factor of the Hα gas.
Numerical simulations of ram pressure stripping indicated that bright Hα
emission is produced at the edges of dense neutral clouds (Tonnesen et al. 2011), so the volume filling factor should be low. From
numerical simulations of Tonnesen et al. (2011)
with the value of ICM thermal pressure consistent with that for ESO 137-001 (their Fig. 2,
left panel), it follows that the typical local density of the Hα gas in
the ESO 137-001 tail is ~1 cm-3. Since the rms electron density observed in
the tail of ESO 137-001 is ~0.045 cm-3 (Sun et
al. 2007), the filling factor, defined as the ratio of the average density and
local density, is estimated to be about 5 × 10⁻². Thus, a reasonable upper
limit on the amount of Hα emitting gas in the tail of IC 3418 would be
about 6 × 10⁷ M⊙. Considering the atomic component
of the gas in the tail, the mass upper limit is
~4 × 10⁸ M⊙ following from the upper limit of
8 × 10⁶ M⊙ per beam
(FWHM ~ 16″, Chung et al. 2009),
and assuming the same tail dimensions used above for the X-ray mass estimate (see Sect.
6). The actual amount of the H i in the
tail may be much lower than the limit since denser clouds have probably condensed into
stars while the diffuse gas had been stripped to large distances (very likely exceeding
the observed length of the tail), as follows from the calculations in Sect. 7. Numerical simulations of Tonnesen et al. (2011) suggest that in the rather low thermal pressure
environment surrounding IC 3418, the mass fractions of cool
(300 K < T < 104
K) and hot
(7 × 10⁵ K < T < 4 × 10⁷
K) components in the stripped gas might be both of about 30% of the total stripped mass
without much evolution as the tail ages from 100 Myr to 250 Myr.
8.5. Origin of star formation in the tail
Galaxies with star forming tails are rare in the Virgo cluster. Extraplanar Hα emission was found in only a few ram pressure stripped galaxies (NGC 4522, NGC 4402, NGC 4330, NGC 4438, Kenney & Koopmann 1999; Cortese et al. 2003; Abramson et al. 2011; Boselli et al. 2005, respectively) where it typically occurs only fairly close to the disk. Those are galaxies with typical (stellar) mass at least a factor of 10 higher than that of IC 3418. In IC 3418 the situation is different – a large number of young stars occur at quite large distances (up to 17 kpc in projection) from the disk distributed in a straight, narrow tail. Chung et al. (2009) suggested that recent star formation in the tail occurred from compression of the stripped H i gas. Similarly, Hester et al. (2010) speculated that star formation in the wake was driven by turbulence that enhances density contrasts and thus aids gas cooling and condensation. A similar example of star formation in situ in the stripped gas is known in the Virgo dwarf galaxy VCC 1249 (Arrigoni Battaia et al. 2012) which is, however, stripped by the ISM of an elliptical galaxy (M49), whereas IC 3418 is stripped by the ICM in the Virgo cluster.
Hydrodynamic AMR simulations of Tonnesen & Bryan (2012) showed that star formation may occur in the ram pressure stripped tails when radiative cooling can overcome the heating from the surrounding ICM and thus is able to cool down the stripped ISM. Our simplified calculations in Sect. 7 have suggested that although molecular gas cannot be directly stripped by ram pressure from IC 3418, some higher density H i than is usual in larger spirals in Virgo (ΣISM < 25 M⊙ pc-2 within the inner 2 kpc disk radius, and <50 M⊙ pc-2 in the outer disk radii) can be stripped thanks to a shallow potential of the galaxy and its proximity to the cluster center. It is then possible that these higher-density clumps were easier to cool and compress by ram pressure together with the thermal pressure of the ICM, supporting their condensation. Moreover, because of the supersonic motion of IC 3418 through the ICM, the thermal pressure of the post-shock environment surrounding the stripped ISM within its Mach cone is probably higher than the pre-shock thermal pressure, which could also enhance condensation of the stripped material. In simulations, the stripped ISM fragments strongly behind the bow shock as a result of turbulence and Rayleigh-Taylor instability (e.g., Roediger et al. 2006). As shown, e.g., by Zhang et al. (2012), the inner disks in nearby dwarf irregulars have proportionally more cool gas than the outer disks. Leroy et al. (2008) indeed suggested that H2 dominates ISM of nearby dwarfs in the inner parts of their disks (<0.25r25) and not at the outer radii. Then ram pressure stripped cool gas and denser clumps originate preferentially from the inner disk regions. The global head-tail morphology of IC 3418 with a narrow (and linear) tail extending behind a larger main body of the galaxy, would then be consistent with the proposed scenario.
9. Conclusion
We searched for cold molecular gas, as well as hot X-ray emitting gas, in IC 3418, a dwarf galaxy that is currently being transformed by ram pressure stripping from an irregular to an early-type galaxy. It contains a prominent tail of young stars, a feature that is rare among other ram pressure stripped Virgo galaxies. Using the IRAM 30 m antenna, we searched for CO emission in five deep integrations in the main body of the galaxy and in its gas-stripped tail. New deep Chandra observations covered the whole system. The main results are:
-
1.
A possible 12CO(2–1) 5σ marginal detection suggested that about 1.2 × 10⁶ M⊙ of molecular gas (assuming a standard Galactic CO-to-H2 conversion factor) is present in the central few arcseconds of IC 3418. Although CO(1–0) emission was not formally detected in the center of the galaxy, there is a 2σ feature with the same velocity range as the CO(2–1) line, which is consistent with a weak emission diluted by the CO(1–0) large beam. An upper limit on molecular gas content in the whole main body of the galaxy is estimated to <5 × 10⁶ M⊙, assuming the standard Galactic CO-to-H2 conversion factor. A similar limit is obtained from the existing upper limits on FIR emission from dust. This is a factor of ~20 less than the original molecular gas content of the galaxy, as estimated from the UV-based SFR before quenching, and the typical gas depletion timescale in spirals of 2 Gyr. While some of this difference may arise from a non-standard CO-to-H2 conversion that could be ~5 times larger than Galactic, we think much of it is due to a true deficiency of molecular gas, given the lack of star formation in the main body.
-
2.
Although the presence of H ii regions in the tail suggests that there must be some dense (presumably molecular) gas in the tail, we have found only (3σ) upper limits of <106 M⊙ in the three observed points covering the outer tail regions. The estimated upper limit on the molecular gas content of the whole tail is ~1 × 10⁷ M⊙. This is an amount that is similar to the estimates based on the observed SFR averaged over the tail, assuming a normal gas depletion timescale of 2 Gyr. Thus with our current sensitivity we cannot claim that the relationship between the dense gas content and the SFR in the tail is unusual.
-
3.
Very sensitive upper limits on the 0.2–5 keV luminosity of the gas-stripped tail has been obtained with Chandra. The corresponding X-ray mass limit of the tail is <3.7 × 107fX1/2 M⊙ (where fX is the filling factor of the X-ray emitting gas) which is a factor of ~280 less than in the tail of the Norma cluster ram pressure stripped galaxy ESO 137-001. The absence of a bright X-ray tail may be mainly due to a low gas content in the tail, associated with its advanced evolutionary state in which gas from the main body of the galaxy is no longer supplied to the tail. A rather low thermal pressure of the surrounding ICM in the Virgo cluster could also account for our non-detection. Existing AMR hydrodynamic numerical simulations would suggest that at least some soft X-ray emission should be observable in the tail of IC 3418; however, these models do not study the evolutionary state after the galaxy is fully stripped.
-
4.
Our semi-analytic calculations have indicated that ISM parcels with rather high column densities up to ~25−50 M⊙ pc-2 (depending on the galactic radius) can be accelerated from the galaxy. However, molecular clouds with densities >100 M⊙ pc-2 cannot be directly stripped from the inner part of IC 3418 by the ram pressure in Virgo, even though this dwarf galaxy has a shallow galactic potential, and it may get close to the cluster center. This explains why some molecular gas could survive in the galaxy center. Moreover, the apparent loss of most of the molecular gas in the galaxy must be due to rather short lifetimes of dense clouds that are similar to stripping timescales, and also due to processes other than direct stripping, meaning some form of cloud destruction after the surrounding low density gas is stripped. Such processes may contain ablation, which includes Kelvin-Helmholtz instabilities, and self-destruction of the clouds by supersonic motion of the galaxy through the Virgo ICM.
-
5.
The surviving central molecular gas reservoir makes it possible for a nuclear star cluster to eventually form, even after most of the galaxy’s gas has been stripped.
-
6.
We have suggested that ram pressure may act as an external agent that, together with the thermal pressure of the ICM and assisted by radiative cooling, compresses the stripped dense clumps and thus may trigger star formation in the tail of the galaxy.
The naming of the tail positions corresponds to Hester et al. (2010). Fumagalli et al. (2011) use a different notation (K-6, K-4, K-3).
The noise over N spectral channels covered by the line σI = Δυres σrmsN1/2 = σrms(Δυres ⟨ ΔυCO ⟩ )1/2, where Δυres is the velocity resolution and ⟨ ΔυCO ⟩ is the mean FWHM linewidth.
We assume a solar value of 12 + log (O/H) = 8.69 (Asplund et al. 2009).
cCO,dark ≈ 0.65exp [0.4/(D/G)′], where (D/G)′ is the dust-to-gas ratio normalized to the Galactic value of 0.01 (see Sect. 4). A typical surface density of a GMC of 100 M⊙ pc-2 is adopted.
Fumagalli et al. (2009) have recently reported H2-deficient galaxies, although these are anemic galaxies, with low surface densities of H i and H2 out to large radii. Whereas truncated galaxies are found almost exclusively in clusters and are clearly ram pressure stripped, the origin of the anemic galaxies, which are found both inside and outside of clusters, is unclear, although they may be starved galaxies.
mAB = −2.5log (fν [erg cm-2 s-1 Hz-1] ) − 48.6.
log SFR (M⊙ yr-1) = log LHα (erg s-1) − 41.27.
Acknowledgments
We acknowledge support by the projects RVO:67985815, M100031203 of the Academy of Sciences of the Czech Republic, GA ČR P209/11/P699, and GA ČR P209/12/1795. Pavel Jáchym was a Fulbright fellow at Yale University in 2009–2010 when this project was prepared. Ming Sun is supported by NASA grants GO2-13102X, GO0-11145C, and GO1-12103A. We thank H. Crowl and S. Tonnesen for useful comments. The scientific results reported in this article are based in part on observations made by the Chandra X-ray Observatory. This research has made use of the NASA/IPAC Extragalactic Database (NED) which is operated by the Jet Propulsion Laboratory, California Institute of Technology, under contract with the National Aeronautics and Space Administration, and of the HyperLeda database (http://leda.univ-lyon1.fr).
References
- Abramson, A., Kenney, J. D. P., Crowl, H. H., et al. 2011, AJ, 141, 164 [NASA ADS] [CrossRef] [Google Scholar]
- Anders, E., & Grevesse, N. 1989, Geochim. Cosmochim. Acta, 53, 197 [Google Scholar]
- Arrigoni Battaia, F., Gavazzi, G., Fumagalli, M., et al. 2012, A&A, 543, A112 [NASA ADS] [CrossRef] [EDP Sciences] [Google Scholar]
- Asplund, M., Grevesse, N., Sauval, A. J., & Scott, P. 2009, ARA&A, 47, 481 [NASA ADS] [CrossRef] [Google Scholar]
- Bell, E. F., & de Jong, R. S. 2000, MNRAS, 312, 497 [NASA ADS] [CrossRef] [Google Scholar]
- Bell, E. F., & de Jong, R. S. 2001, ApJ, 550, 212 [NASA ADS] [CrossRef] [Google Scholar]
- Bigiel, F., Leroy, A., Walter, F., et al. 2008, AJ, 136, 2846 [NASA ADS] [CrossRef] [Google Scholar]
- Binggeli, B., Tammann, G. A., & Sandage, A. 1987, AJ, 94, 251 [NASA ADS] [CrossRef] [Google Scholar]
- Binney, J., & Tremaine, S. 2008, Galactic Dynamics, 2nd edn. (Princeton University Press) [Google Scholar]
- Boissier, S., Boselli, A., Duc, P.-A., et al. 2012, A&A, 545, A142 [NASA ADS] [CrossRef] [EDP Sciences] [Google Scholar]
- Bolatto, A. D., Leroy, A. K., Rosolowsky, E., Walter, F., & Blitz, L. 2008, ApJ, 686, 948 [NASA ADS] [CrossRef] [Google Scholar]
- Boselli, A., & Gavazzi, G. 2006, PASP, 118, 517 [NASA ADS] [CrossRef] [Google Scholar]
- Boselli, A., Lequeux, J., & Gavazzi, G. 2002, A&A, 384, 33 [NASA ADS] [CrossRef] [EDP Sciences] [Google Scholar]
- Boselli, A., Boissier, S., Cortese, L., et al. 2005, ApJ, 623, L13 [NASA ADS] [CrossRef] [Google Scholar]
- Boselli, A., Boissier, S., Cortese, L., & Gavazzi, G. 2008, ApJ, 674, 742 [NASA ADS] [CrossRef] [Google Scholar]
- Bothwell, M. S., Kennicutt, R. C., & Lee, J. C. 2009, MNRAS, 400, 154 [NASA ADS] [CrossRef] [Google Scholar]
- Chung, A., van Gorkom, J. H., Kenney, J. D. P., & Vollmer, B. 2007, ApJ, 659, L115 [NASA ADS] [CrossRef] [Google Scholar]
- Chung, A., van Gorkom, J. H., Kenney, J. D. P., Crowl, H., & Vollmer, B. 2009, AJ, 138, 1741 [NASA ADS] [CrossRef] [Google Scholar]
- Cortese, L., Gavazzi, G., Iglesias-Paramo, J., Boselli, A., & Carrasco, L. 2003, A&A, 401, 471 [NASA ADS] [CrossRef] [EDP Sciences] [Google Scholar]
- Cortese, L., Marcillac, D., Richard, J., et al. 2007, MNRAS, 376, 157 [NASA ADS] [CrossRef] [Google Scholar]
- Cortese, L., Bendo, G. J., Boselli, A., et al. 2010, A&A, 518, L63 [NASA ADS] [CrossRef] [EDP Sciences] [Google Scholar]
- Crowl, H. H., & Kenney, J. D. P. 2006, ApJ, 649, L75 [NASA ADS] [CrossRef] [Google Scholar]
- Crowl, H. H., Kenney, J. D. P., van Gorkom, J. H., & Vollmer, B. 2005, AJ, 130, 65 [NASA ADS] [CrossRef] [Google Scholar]
- Evans, A. S., Mazzarella, J. M., Surace, J. A., et al. 2005, ApJS, 159, 197 [NASA ADS] [CrossRef] [Google Scholar]
- Feldmann, R., Gnedin, N. Y., & Kravtsov, A. V. 2012, ApJ, 758, 127 [NASA ADS] [CrossRef] [Google Scholar]
- Fumagalli, M., & Gavazzi, G. 2008, A&A, 490, 571 [NASA ADS] [CrossRef] [EDP Sciences] [Google Scholar]
- Fumagalli, M., Krumholz, M. R., Prochaska, J. X., Gavazzi, G., & Boselli, A. 2009, ApJ, 697, 1811 [NASA ADS] [CrossRef] [Google Scholar]
- Fumagalli, M., Gavazzi, G., Scaramella, R., & Franzetti, P. 2011, A&A, 528, A46 [NASA ADS] [CrossRef] [EDP Sciences] [Google Scholar]
- Gavazzi, G., Boselli, A., Donati, A., Franzetti, P., & Scodeggio, M. 2003, A&A, 400, 451 [NASA ADS] [CrossRef] [EDP Sciences] [Google Scholar]
- Gavazzi, G., Boselli, A., van Driel, W., & O’Neil, K. 2005, A&A, 429, 439 [NASA ADS] [CrossRef] [EDP Sciences] [Google Scholar]
- Gavazzi, G., Boselli, A., Cortese, L., et al. 2006, A&A, 446, 839 [NASA ADS] [CrossRef] [EDP Sciences] [Google Scholar]
- Ghigna, S., Moore, B., Governato, F., et al. 1998, MNRAS, 300, 146 [NASA ADS] [CrossRef] [Google Scholar]
- Gil de Paz, A., Boissier, S., Madore, B. F., et al. 2007, ApJS, 173, 185 [NASA ADS] [CrossRef] [Google Scholar]
- Guillard, P., Boulanger, F., Pineau des Forêts, G., et al. 2012, ApJ, 749, 158 [NASA ADS] [CrossRef] [Google Scholar]
- Gunn, J. E., & Gott, III, J. R. 1972, ApJ, 176, 1 [NASA ADS] [CrossRef] [Google Scholar]
- Hester, J. A., Seibert, M., Neill, J. D., et al. 2010, ApJ, 716, L14 [NASA ADS] [CrossRef] [Google Scholar]
- Hunter, D. A., Elmegreen, B. G., & Ludka, B. C. 2010, AJ, 139, 447 [NASA ADS] [CrossRef] [Google Scholar]
- Israel, F. P. 1997, A&A, 328, 471 [NASA ADS] [Google Scholar]
- Jáchym, P., Palouš, J., Köppen, J., & Combes, F. 2007, A&A, 472, 5 [NASA ADS] [CrossRef] [EDP Sciences] [Google Scholar]
- Jáchym, P., Köppen, J., Palouš, J., & Combes, F. 2009, A&A, 500, 693 [NASA ADS] [CrossRef] [EDP Sciences] [Google Scholar]
- Kalberla, P. M. W., Burton, W. B., Hartmann, D., et al. 2005, A&A, 440, 775 [NASA ADS] [CrossRef] [EDP Sciences] [Google Scholar]
- Kapferer, W., Sluka, C., Schindler, S., Ferrari, C., & Ziegler, B. 2009, A&A, 499, 87 [NASA ADS] [CrossRef] [EDP Sciences] [Google Scholar]
- Kenney, J. D. P., & Koopmann, R. A. 1999, AJ, 117, 181 [NASA ADS] [CrossRef] [Google Scholar]
- Kenney, J. D., & Young, J. S. 1986, ApJ, 301, L13 [NASA ADS] [CrossRef] [Google Scholar]
- Kenney, J. D. P., & Young, J. S. 1989, ApJ, 344, 171 [NASA ADS] [CrossRef] [Google Scholar]
- Kenney, J. D. P., van Gorkom, J. H., & Vollmer, B. 2004, AJ, 127, 3361 [NASA ADS] [CrossRef] [Google Scholar]
- Kennicutt, R. C., & Evans, N. J. 2012, ARA&A, 50, 531 [NASA ADS] [CrossRef] [Google Scholar]
- Kewley, L. J., & Ellison, S. L. 2008, ApJ, 681, 1183 [NASA ADS] [CrossRef] [Google Scholar]
- Kirby, E. M., Koribalski, B., Jerjen, H., & López-Sánchez, Á. 2012, MNRAS, 420, 2924 [NASA ADS] [CrossRef] [Google Scholar]
- Komugi, S., Yasui, C., Kobayashi, N., et al. 2011, PASJ, 63, L1 [NASA ADS] [Google Scholar]
- Koopmann, R. A., & Kenney, J. D. P. 2004, ApJ, 613, 851 [NASA ADS] [CrossRef] [Google Scholar]
- Kormendy, J., & Bender, R. 2012, ApJS, 198, 2 [NASA ADS] [CrossRef] [Google Scholar]
- Leitherer, C., Schaerer, D., Goldader, J. D., et al. 1999, ApJS, 123, 3 [NASA ADS] [CrossRef] [Google Scholar]
- Leroy, A., Bolatto, A. D., Simon, J. D., & Blitz, L. 2005, ApJ, 625, 763 [NASA ADS] [CrossRef] [Google Scholar]
- Leroy, A., Bolatto, A., Stanimirovic, S., et al. 2007a, ApJ, 658, 1027 [NASA ADS] [CrossRef] [Google Scholar]
- Leroy, A., Cannon, J., Walter, F., Bolatto, A., & Weiss, A. 2007b, ApJ, 663, 990 [NASA ADS] [CrossRef] [MathSciNet] [Google Scholar]
- Leroy, A. K., Walter, F., Brinks, E., et al. 2008, AJ, 136, 2782 [NASA ADS] [CrossRef] [Google Scholar]
- Leroy, A. K., Walter, F., Sandstrom, K., et al. 2013, AJ, 146, 19 [NASA ADS] [CrossRef] [Google Scholar]
- Lisenfeld, U., & Ferrara, A. 1998, ApJ, 496, 145 [NASA ADS] [CrossRef] [Google Scholar]
- Maloney, P., & Black, J. H. 1988, ApJ, 325, 389 [NASA ADS] [CrossRef] [Google Scholar]
- Matsushita, K., Belsole, E., Finoguenov, A., & Böhringer, H. 2002, A&A, 386, 77 [NASA ADS] [CrossRef] [EDP Sciences] [Google Scholar]
- Mei, S., Blakeslee, J. P., Côté, P., et al. 2007, ApJ, 655, 144 [NASA ADS] [CrossRef] [Google Scholar]
- Mizuno, N., Rubio, M., Mizuno, A., et al. 2001, PASJ, 53, L45 [NASA ADS] [Google Scholar]
- Mo, H., van den Bosch, F. C., & White, S. 2010, Galaxy Formation and Evolution (Cambridge University Press) [Google Scholar]
- Navarro, J. F., Frenk, C. S., & White, S. D. M. 1996, ApJ, 462, 563 [NASA ADS] [CrossRef] [Google Scholar]
- Obreschkow, D., & Rawlings, S. 2009, MNRAS, 394, 1857 [NASA ADS] [CrossRef] [Google Scholar]
- Paturel, G., Petit, C., Prugniel, P., et al. 2003, A&A, 412, 45 [NASA ADS] [CrossRef] [EDP Sciences] [Google Scholar]
- Pettini, M., & Pagel, B. E. J. 2004, MNRAS, 348, L59 [NASA ADS] [CrossRef] [Google Scholar]
- Pineda, J. L., Goldsmith, P. F., Chapman, N., et al. 2010, ApJ, 721, 686 [NASA ADS] [CrossRef] [Google Scholar]
- Poggianti, B. M., Smail, I., Dressler, A., et al. 1999, ApJ, 518, 576 [NASA ADS] [CrossRef] [Google Scholar]
- Quilis, V., Moore, B., & Bower, R. 2000, Science, 288, 1617 [NASA ADS] [CrossRef] [PubMed] [Google Scholar]
- Randall, S., Nulsen, P., Forman, W. R., et al. 2008, ApJ, 688, 208 [NASA ADS] [CrossRef] [Google Scholar]
- Roediger, E., & Hensler, G. 2005, A&A, 433, 875 [NASA ADS] [CrossRef] [EDP Sciences] [Google Scholar]
- Roediger, E., Brüggen, M., & Hoeft, M. 2006, MNRAS, 371, 609 [NASA ADS] [CrossRef] [Google Scholar]
- Schindler, S. 1999, A&A, 349, 435 [NASA ADS] [Google Scholar]
- Schruba, A., Leroy, A. K., Walter, F., et al. 2012, AJ, 143, 138 [NASA ADS] [CrossRef] [Google Scholar]
- Shibata, R., Matsushita, K., Yamasaki, N. Y., et al. 2001, ApJ, 549, 228 [NASA ADS] [CrossRef] [Google Scholar]
- Smith, R. J., Lucey, J. R., Hammer, D., et al. 2010, MNRAS, 408, 1417 [NASA ADS] [CrossRef] [Google Scholar]
- Sun, M., & Vikhlinin, A. 2005, ApJ, 621, 718 [NASA ADS] [CrossRef] [Google Scholar]
- Sun, M., Donahue, M., & Voit, G. M. 2007, ApJ, 671, 190 [NASA ADS] [CrossRef] [Google Scholar]
- Sun, M., Donahue, M., Roediger, E., et al. 2010, ApJ, 708, 946 [NASA ADS] [CrossRef] [Google Scholar]
- Taylor, C. L., Kobulnicky, H. A., & Skillman, E. D. 1998, AJ, 116, 2746 [NASA ADS] [CrossRef] [Google Scholar]
- Tonnesen, S., & Bryan, G. L. 2009, ApJ, 694, 789 [NASA ADS] [CrossRef] [Google Scholar]
- Tonnesen, S., & Bryan, G. L. 2010, ApJ, 709, 1203 [NASA ADS] [CrossRef] [Google Scholar]
- Tonnesen, S., & Bryan, G. L. 2012, MNRAS, 2609 [Google Scholar]
- Tonnesen, S., Bryan, G. L., & Chen, R. 2011, ApJ, 731, 98 [NASA ADS] [CrossRef] [Google Scholar]
- Tremonti, C. A., Heckman, T. M., Kauffmann, G., et al. 2004, ApJ, 613, 898 [NASA ADS] [CrossRef] [Google Scholar]
- Tuffs, R. J., Popescu, C. C., Pierini, D., et al. 2002, ApJS, 139, 37 [NASA ADS] [CrossRef] [Google Scholar]
- van Gorkom, J. H. 2004, Clusters of Galaxies: Probes of Cosmological Structure and Galaxy Evolution, 305 [Google Scholar]
- Vollmer, B. 2009, A&A, 502, 427 [NASA ADS] [CrossRef] [EDP Sciences] [Google Scholar]
- Vollmer, B., Cayatte, V., Balkowski, C., & Duschl, W. J. 2001, ApJ, 561, 708 [NASA ADS] [CrossRef] [Google Scholar]
- Vollmer, B., Braine, J., Pappalardo, C., & Hily-Blant, P. 2008, A&A, 491, 455 [NASA ADS] [CrossRef] [EDP Sciences] [Google Scholar]
- Vollmer, B., Wong, O. I., Braine, J., Chung, A., & Kenney, J. D. P. 2012, A&A, 543, A33 [NASA ADS] [CrossRef] [EDP Sciences] [Google Scholar]
- Weżgowiec, M., Vollmer, B., Ehle, M., et al. 2011, A&A, 531, A44 [NASA ADS] [CrossRef] [EDP Sciences] [Google Scholar]
- Woudt, P. A., Kraan-Korteweg, R. C., Lucey, J., Fairall, A. P., & Moore, S. A. W. 2008, MNRAS, 383, 445 [NASA ADS] [CrossRef] [Google Scholar]
- Yoshida, M., Yagi, M., Komiyama, Y., et al. 2008, ApJ, 688, 918 [NASA ADS] [CrossRef] [Google Scholar]
- Young, J. S., Xie, S., Tacconi, L., et al. 1995, ApJS, 98, 219 [NASA ADS] [CrossRef] [Google Scholar]
- Zhang, H.-X., Hunter, D. A., & Elmegreen, B. G. 2012, ApJ, 754, 29 [NASA ADS] [CrossRef] [Google Scholar]
All Tables
Molecular gas mass estimates corresponding to our IRAM detection and upper limits on CO luminosity in the main body and in the tail, assuming a Galactic CO-to-H2 conversion factor.
Parameters of galaxy and cluster models used for semi-analytic calculations of ram pressure stripping.
Star formation rates in the observed tail regions and corresponding lower limits on local CO-to-H2 conversion factor.
Upper limit (3σ) masses (in M⊙) of gas components issued from different observations of the tail.
All Figures
|
Fig. 1 Location of IC 3418 in the Virgo cluster. The background image shows the distribution of the 0.5–2.0 keV ICM as observed in X-rays with ROSAT (Credit: S. L. Snowden, http://heasarc.gsfc.nasa.gov). Silhouette of a GALEX UV image of IC 3418 is displayed at the position of the galaxy. |
| In the text | |
|
Fig. 2 Location of IC 3418 in the (FUV−NUV) − MB color–magnitude diagram of nearby galaxies from the sample of Gil de Paz et al. (2007). FUV−NUV = 0.85 ± 0.10 (Gil de Paz et al. 2007) and mB corrected for internal and Galactic extinction is 14.85 mag (NED), i.e., MB = −16.2. Red dots are elliptical/lenticular galaxies, dark green triangles are early-type spirals, light green triangles are late-type spirals, blue asterisks are irregular and compact galaxies, and black diamonds are galaxies lacking morphological classification. Figure adapted from Gil de Paz et al. (2007). |
| In the text | |
|
Fig. 3 Observed positions on a GALEX image (FUV in blue, NUV in yellow) of IC 3418 with 12CO(1–0) beams (FWHM = 21″) of the 30 m IRAM telescope displayed – two positions (B1, B2) in the main body of the galaxy and three (K4, K6, K8) in the outer part of the tail. The CO(2–1) beams have the same centers but half the diameter as the circles shown – a CO(2–1) beam is shown in B1 with a dashed circle. The background image is adopted from Hester et al. (2010). |
| In the text | |
|
Fig. 4 Marginal detection in the central main body position B1 (left), spectra in the off-center position B2 (middle), and combined K4+K6+K8 tail spectra (right): WILMA CO(2–1) (top) and WILMA CO(1–0) (bottom) spectra smoothed to 10.4 km s-1 resolution. Dashed lines show ± 1σ noise levels; y-axis scaling is set to ± 4σ. The velocity scale is LSR; for the sky position of IC 3418, υhelio = υLSR − 3.2 km s-1. |
| In the text | |
|
Fig. 5 Tail positions K4, K6, and K8: WILMA CO(2–1) (top) and WILMA CO(1–0) (bottom) spectra smoothed to 10.4 km s-1 resolution. Dashed lines show ± 1σ noise levels; y-axis scaling is set to ± 4σ. |
| In the text | |
|
Fig. 6 Normalized CO(1–0) luminosity as a function of K-band luminosity. IC 3418 is represented with a red arrow with the head corresponding to the marginally detected (B1) CO luminosity and the upper tail bar to the upper limit for the total luminosity of the disk. IC 3418 is compared with a set of nearby low-mass star-forming galaxies from the HERACLES survey (together with more massive HERACLES galaxies, and other Local Group and nearby galaxies) used by Schruba et al. (2012) (filled circles), and with a sample of compact late-type spiral and irregular galaxies of Leroy et al. (2005) (empty circles), plus few starburst dwarf galaxies from Taylor et al. (1998) (triangles), and DDO154 (Komugi et al. 2011). Upper limits are plotted with symbols with small arrows. Colors represent metallicity 12 + log (O/H). The color of the IC 3418 arrow does not correspond to its metallicity (see Sect. 5.2). Small empty circles show marginal detections of Leroy et al. (2005). |
| In the text | |
|
Fig. 7 Pre-peak stripping: vertical distances that ISM elements can reach with different column densities from radii 0–5 kpc (with 1 kpc step; from left to right) in our model 100 Myr before the peak ram pressure. |
| In the text | |
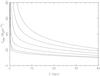 |
Fig. 8 Post-peak stripping. Same as in Fig. 7, but 100 Myr after the peak ram pressure. |
| In the text | |
|
Fig. 9 Pre-peak stripping: vertical velocities to which ISM elements can be accelerated with different column densities from radii 0–5 kpc (with 1 kpc step; from left to right) in our model 100 Myr before the peak ram pressure. |
| In the text | |
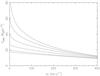 |
Fig. 10 Post-peak stripping. Same as in Fig. 9, but 100 Myr after the peak ram pressure. |
| In the text | |
|
Fig. 11 Time evolution of stripping radii of ISM parcels with different column densities: H i-like (radius-dependent Miyamoto-Nagai profile with Σ0 = 10 M⊙ pc-2 which yields ΣR = 5 kpc = 0.3 M⊙ pc-2), and constant ΣISM = 10, 15, 25, and 50 M⊙ pc-2 (from left to right) in our model. Ram pressure time profile along our model orbit is shown with the dashed line. |
| In the text | |
Current usage metrics show cumulative count of Article Views (full-text article views including HTML views, PDF and ePub downloads, according to the available data) and Abstracts Views on Vision4Press platform.
Data correspond to usage on the plateform after 2015. The current usage metrics is available 48-96 hours after online publication and is updated daily on week days.
Initial download of the metrics may take a while.