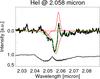
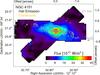
Fig. 9
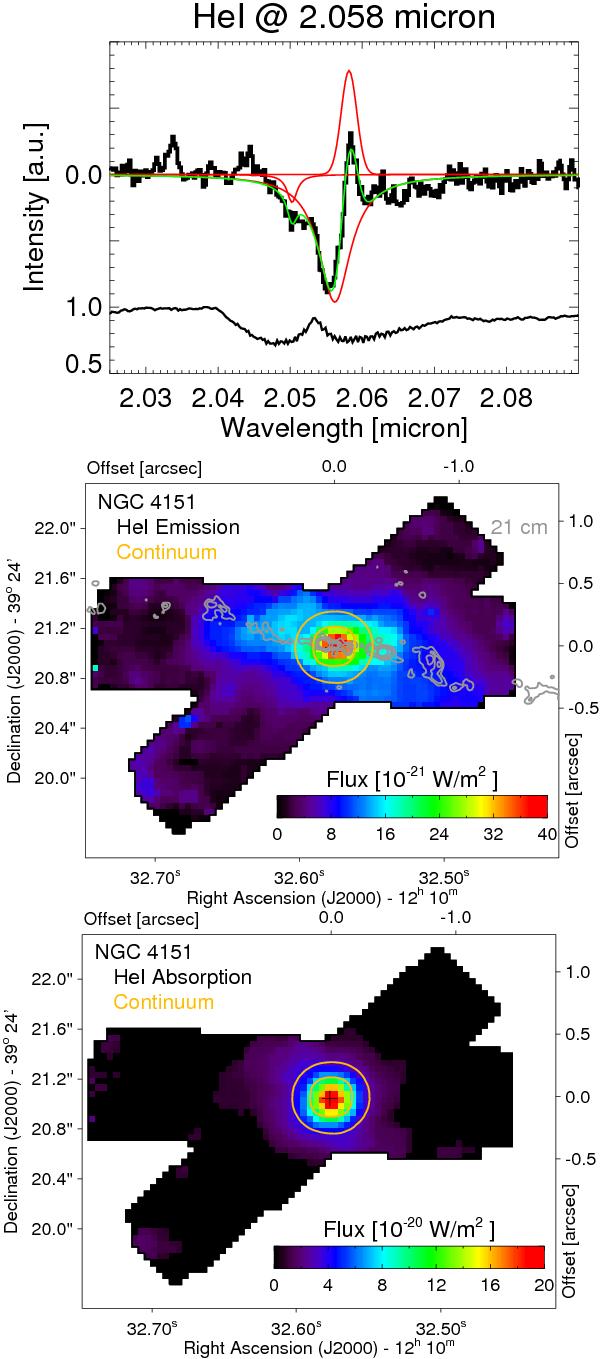
HeIλ2.0581 μm line complex. Top: continuum-subtracted line complex of HeI extracted from a circular aperture with a radius of 400 mas centered on the nucleus; data are plotted in black, the fitted Lorentzian absorption and Gaussian emission components are plotted in red, total fit plotted in green. The continuum was fitted with a parabola using emission/absorption-free wavelength channels to the left and to the right of the line complex. Below the extracted line complex we plot the telluric spectrum around the HeI line complex. In this spectral regime the atmospheric transmission drops to about 75%, as indicated. Middle and bottom: HeI emission (middle) and absorption flux (bottom) derived from the three-component fit, as explained in the text. To increase the S/N we used a running aperture of 5 × 5 prior to extraction. Continuum isophotes are marked in yellow at the wavelength of HeI for 20% and 50% of the continuum peak intensity. North is up and east to the left. Radio contours in emission map in levels of .5, 1, 2, and 4 mJy beam-1 with a beam size about four times smaller than our angular sampling.
Current usage metrics show cumulative count of Article Views (full-text article views including HTML views, PDF and ePub downloads, according to the available data) and Abstracts Views on Vision4Press platform.
Data correspond to usage on the plateform after 2015. The current usage metrics is available 48-96 hours after online publication and is updated daily on week days.
Initial download of the metrics may take a while.