Fig. 8
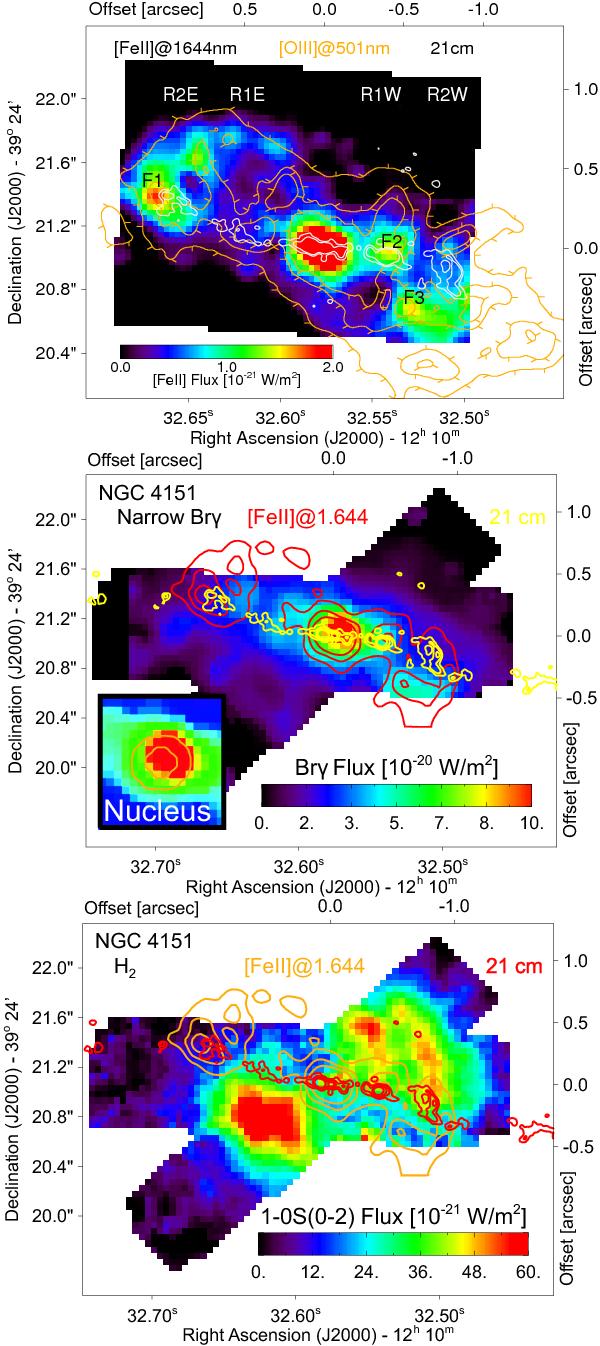
Top: [FeII]λ1.644 μm emission, [OIII]λ501 nm emission contours taken from Kaiser et al. (2000) in yellow and 21 cm radio contours taken from Mundell et al. (2003) in white. Our naming scheme for the prominent [FeII] emitting regions (F1-3) and the 21 cm radio continuum knots (R2E, R1E, R1W, R2W) is indicated. Radio contours in levels of .5 and 1 mJy beam-1 only. Middle: Brγ emission map extracted from a running aperture of 3 × 3. [FeII] emission contours in red, 21 cm emission contours in yellow. Inset: The inset shows Brγ emission from the nuclear region on the same flux scale. The orange contours represent continuum isophotes (50% and 20% of the peak value) at the wavelength of Brγ. Bottom: integrated 1-0S(0-2) flux, [FeII]λ1.644 μm, and 21 cm radio data taken from Mundell et al. (2003). The H2 data were extracted the same way as the Brγ emission map. All figures: north is up and east to the left. Radio contours in levels of .5, 1, 2, and 4 mJy beam-1 with a beam size app. four times smaller than our angular sampling.
Current usage metrics show cumulative count of Article Views (full-text article views including HTML views, PDF and ePub downloads, according to the available data) and Abstracts Views on Vision4Press platform.
Data correspond to usage on the plateform after 2015. The current usage metrics is available 48-96 hours after online publication and is updated daily on week days.
Initial download of the metrics may take a while.