Free Access
Fig. 6
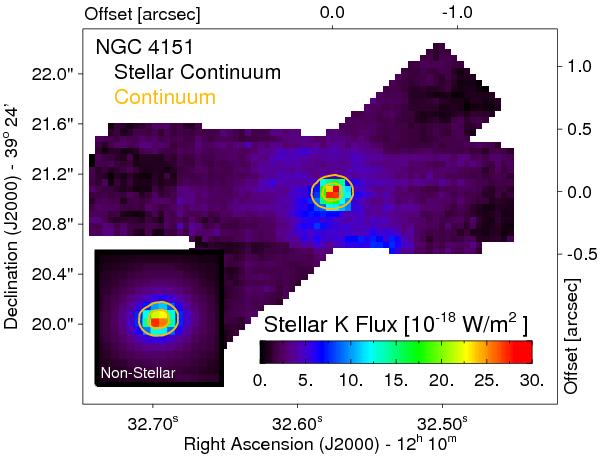
Stellar flux derived from the spectral decomposition described in the text. The non-stellar continuum is not on the same flux scale. Corresponding continuum contours (20% and 50% of the peak intensity) are denoted in yellow. North is up and east to the left.
Current usage metrics show cumulative count of Article Views (full-text article views including HTML views, PDF and ePub downloads, according to the available data) and Abstracts Views on Vision4Press platform.
Data correspond to usage on the plateform after 2015. The current usage metrics is available 48-96 hours after online publication and is updated daily on week days.
Initial download of the metrics may take a while.