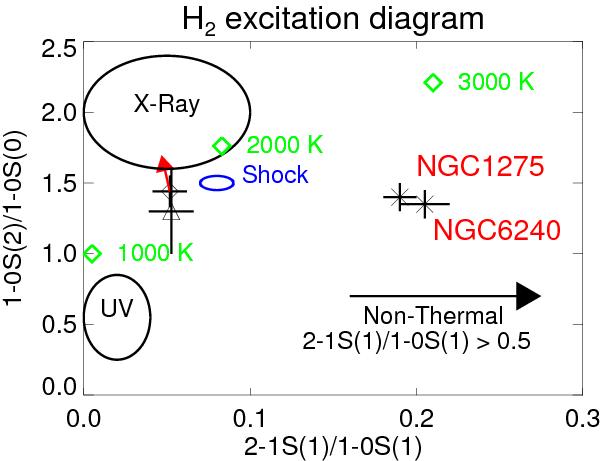
Fig. 26

“Mouri diagram”. The data regions correspond to shocks (Brand et al. 1989), non-thermal (Black & van Dishoeck 1987) and thermal UV (Sternberg & Dalgarno 1989), and X-ray (Lepp & McCray 1983; Draine & Woods 1990). The diamond corresponds to data extracted from our whole FoV, the triangle to data extracted from the bright H2 knot in the east, and stars to data from other galaxies (NGC 1275 and NGC 6240 taken from Krabbe et al. 2000). The red arrow shows the displacement for a reddening correction of AK = 1.
Current usage metrics show cumulative count of Article Views (full-text article views including HTML views, PDF and ePub downloads, according to the available data) and Abstracts Views on Vision4Press platform.
Data correspond to usage on the plateform after 2015. The current usage metrics is available 48-96 hours after online publication and is updated daily on week days.
Initial download of the metrics may take a while.


