Fig. 19
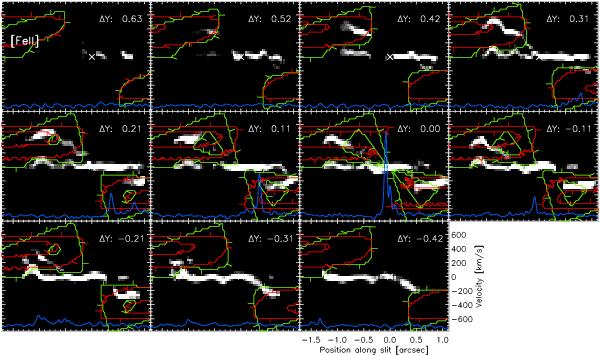
Position velocity diagrams of 0.105 arcsec wide pseudoslits aligned with the NLR at a PA of 60° extracted from the modeled datacube that contains emission from the single- and double-Gaussian fits to the emission line. ΔY denotes the separation of the pseudoslits in arcsec. For ΔY = 0 the pseudoslit covers the nucleus. The green/red contours indicate the allowed regions according to the velocity laws by Das et al. (2005) and Storchi-Bergmann et al. (2010), where tick marks point in the direction of forbidden velocity ranges. The slightly staggered arrangement of the model calculations is not real but is rather due to calculations performed on a grid. The cross marks the center position of the pseudoslit and coincides with the position of the nucleus. 21 cm radio continuum emission along the pseudoslits is plotted in blue.
Current usage metrics show cumulative count of Article Views (full-text article views including HTML views, PDF and ePub downloads, according to the available data) and Abstracts Views on Vision4Press platform.
Data correspond to usage on the plateform after 2015. The current usage metrics is available 48-96 hours after online publication and is updated daily on week days.
Initial download of the metrics may take a while.