Fig. 18
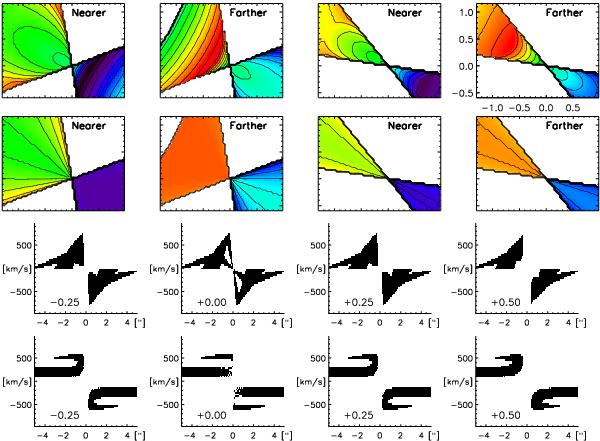
Extreme velocities from the bicone surfaces and position velocity diagrams extracted from the models by Das et al. (2005) and Storchi-Bergmann et al. (2010). Row 1: velocities on the bicone surfaces that are nearer and farther to the observer according to the Das et al. (2005) model. Color scales from −700 km s-1 (blue) to 700 km s-1 (red), contours are in steps of 100 km s-1. Major tick marks correspond to 0.5 arcsec. The surfaces shown cover our FoV. North is up, east to the left. Row 2: same as row 1 for the constant-velocity model by Storchi-Bergmann et al. (2010). Row 3: position velocity diagrams extracted from pseudoslits aligned along the NLR at a position angle of 60° according to the Das et al. (2005) model. The slitwidth/slitlength is 0.15/5 arcsec and the pseudoslits are moved −0.2, 0, 0.2, and 0.4 arcsec away from the nucleus perpendicular to the direction of the NLR. The black area indicates the region in the pv-diagram from which emission is expected according to the model. Note that our observations only cover the inner arcsecond. Row 4: Same as row 3, but for the constant-velocity model by Storchi-Bergmann et al. (2010).
Current usage metrics show cumulative count of Article Views (full-text article views including HTML views, PDF and ePub downloads, according to the available data) and Abstracts Views on Vision4Press platform.
Data correspond to usage on the plateform after 2015. The current usage metrics is available 48-96 hours after online publication and is updated daily on week days.
Initial download of the metrics may take a while.