Fig. 16
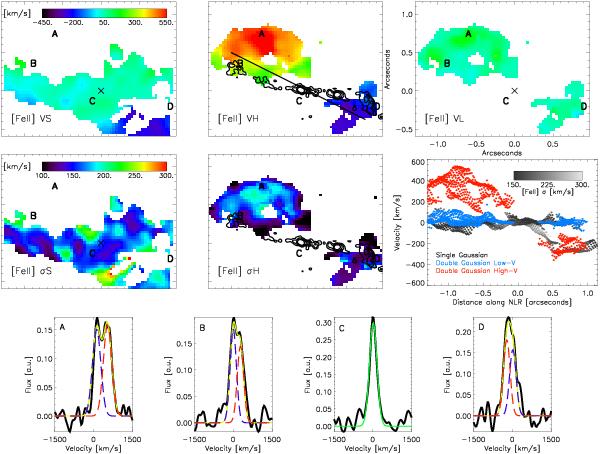
[FeII] dynamics as derived from single- and double-Gaussian fits. All slices with constant wavelength of the datacube were convolved with a Gaussian seeing disk with a FWHM of 0.07 arcsec. The cross denotes the position of the continuum peak. Mayor tick marks in the velocity and dispersion fields correspond to 0.50 arcsec. Letters A to D mark positions from which the spectra shown in the last row were extracted. The black line indicates the position angle of the bicone of 60°. Top: centroid velocities from single-Gaussian fits, VS (left), high/low velocity component from double-Gaussian fits, VH/VL (middle/right). The contours in the middle image in this row represent the 21 cm radio continuum contours (Mundell et al. 2003) at levels of .5, 1, 2, and 4 mJy beam-1 with a beam size about four times smaller than our angular sampling. Middle left and middle: Gausian dispersions of the single- and double-Gaussian fits (σS and σH). Middle right: Centroid velocity of our fits as a function of distance from the continuum peak along the NLR at a position angle of 60°. Black/red/blue points represent the centroid velocities derived from single-Gaussian fits and high- and low-velocity components in case of double-Gaussian fits. Bottom: [FeII] line profiles extracted from various regions with Gaussian fits overplotted. Measured line profile in black, single-Gaussian fits in green, combined double-Gaussian fits in yellow, the low/high velocity component of the double-Gaussian fit in red/blue.
Current usage metrics show cumulative count of Article Views (full-text article views including HTML views, PDF and ePub downloads, according to the available data) and Abstracts Views on Vision4Press platform.
Data correspond to usage on the plateform after 2015. The current usage metrics is available 48-96 hours after online publication and is updated daily on week days.
Initial download of the metrics may take a while.