Fig. 15
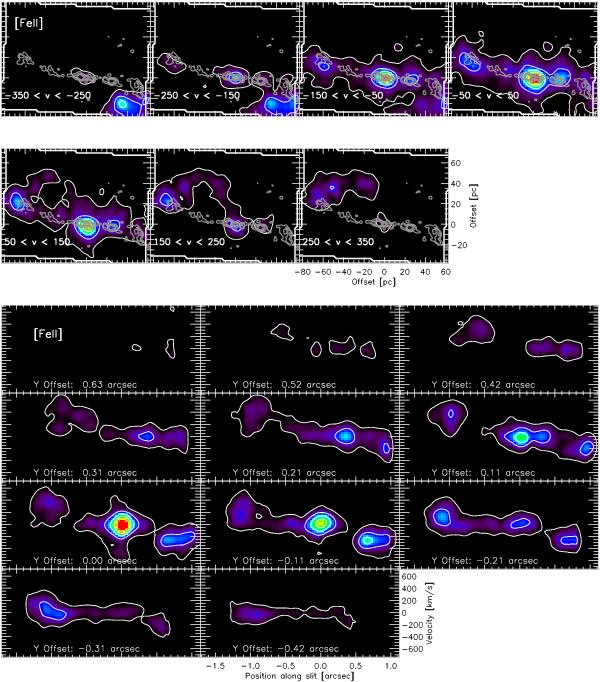
Top: [FeII]λ1.644 μm channel maps. Radio contours overplotted in gray (.5, 1, 2 and 4 mJy beam-1 with a beamsize about four times smaller than our angular sampling). The white contours are 10%, 25%, 40%, and 55% of the [FeII] peak intensity. Velocity ranges are given in km s-1. North is up and east to the left. Bottom: position velocity diagrams of [FeII]λ1.644 μm extracted from pseudoslits oriented along the NLR with a PA of 60°. The Y Offset is the angular offset of the pseudoslit with respect to the nucleus. Along the pseudoslit, position 0 indicates the position of the continuum peak. Contours represent 10%, 25%, 40%, and 55% of the [FeII] peak intensity.
Current usage metrics show cumulative count of Article Views (full-text article views including HTML views, PDF and ePub downloads, according to the available data) and Abstracts Views on Vision4Press platform.
Data correspond to usage on the plateform after 2015. The current usage metrics is available 48-96 hours after online publication and is updated daily on week days.
Initial download of the metrics may take a while.