Fig. 14
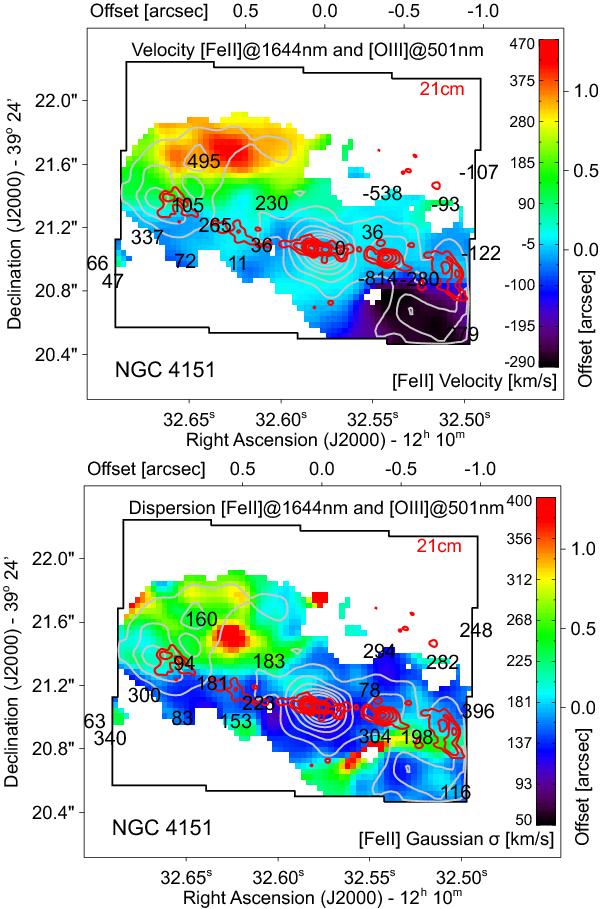
[FeII]λ1.644 μm velocity and dispersion field derived from single-Gaussian fits. The black box indicates our FoV. North is up and east to the left. Gray contours represent [FeII] flux isophotes to guide the eye. Top: [FeII]λ1.644 μm velocity field, 21 cm radio contours in red (.5, 1, 2 and 4 mJy beam-1 with a beam size about four times smaller than our angular sampling) taken from Mundell et al. (2003), and [FeII]λ1.644 μm contours in gray. Numbers in the plot indicate velocities of prominent [OIII] clouds (taken from Kaiser et al. 2000). Bottom: [FeII]λ1.644 μm dispersion field, 21 cm radio contours in red (.5, 1, 2 and 4 mJy beam-1 with a beam size app. four times smaller than our angular sampling) taken from Mundell et al. (2003), and [FeII]λ1.644 μm contours in gray. Numbers in the plot indicate dispersions of prominent [OIII] clouds (taken from Kaiser et al. 2000).
Current usage metrics show cumulative count of Article Views (full-text article views including HTML views, PDF and ePub downloads, according to the available data) and Abstracts Views on Vision4Press platform.
Data correspond to usage on the plateform after 2015. The current usage metrics is available 48-96 hours after online publication and is updated daily on week days.
Initial download of the metrics may take a while.