Free Access
Fig. 13
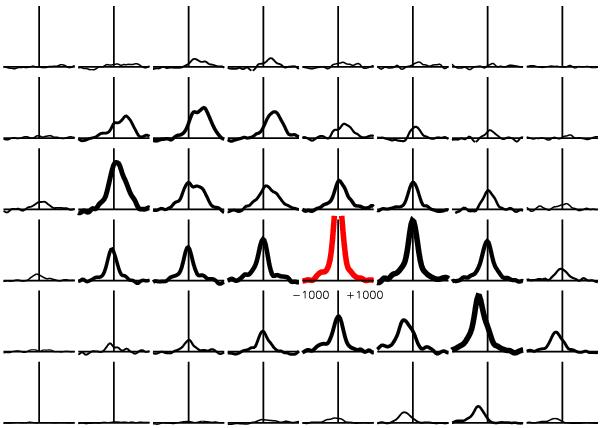
[FeII] emission line profiles extracted from apertures of 385 × 385 mas. [FeII] emission from the nucleus in red. North is up, east to the left. The x-axis represents −1000 km s-1 to +1000 km s-1. The thickness of the emission line profiles scales with flux to guide the eye.
Current usage metrics show cumulative count of Article Views (full-text article views including HTML views, PDF and ePub downloads, according to the available data) and Abstracts Views on Vision4Press platform.
Data correspond to usage on the plateform after 2015. The current usage metrics is available 48-96 hours after online publication and is updated daily on week days.
Initial download of the metrics may take a while.