Fig. 11
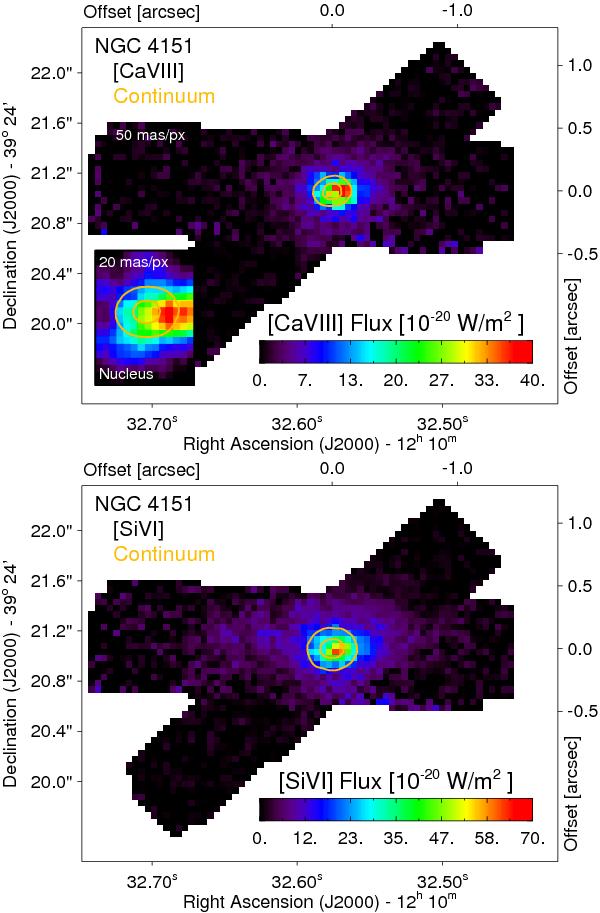
[CaVIII] (top) and [SiVI] (bottom) emission morphology extracted from every spaxel. The yellow contours represent continuum isophotes at the wavelength of [CaVIII] for 20% and 50% of the continuum peak intensity. The inset (top figure) shows a [CaVIII] emission map derived from the data set with a sampling of 20 mas per pixel. North is up and east to the left.
Current usage metrics show cumulative count of Article Views (full-text article views including HTML views, PDF and ePub downloads, according to the available data) and Abstracts Views on Vision4Press platform.
Data correspond to usage on the plateform after 2015. The current usage metrics is available 48-96 hours after online publication and is updated daily on week days.
Initial download of the metrics may take a while.