Fig. 4
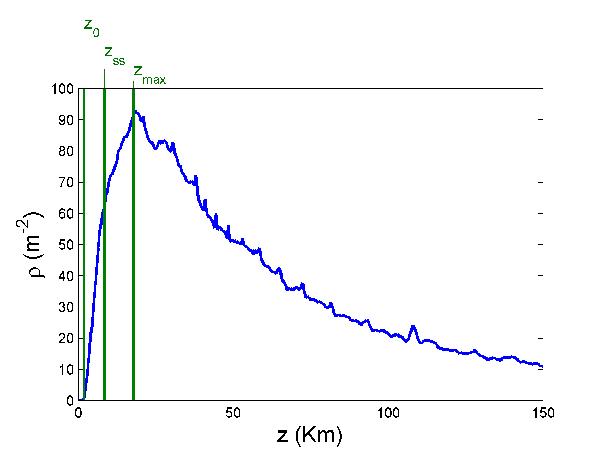
Plot of mean branch point density versus propagation distance for r0 = 10.28 cm and averaged over twenty values of the inner scale from 0.05 to 1.0 cm. Overlaid are z0, zss and zρmax. In standard texts (Sasiela 2007), the Rytov approximation is shown to fail at  . Empirically, it begins to deviate from the theoretical curve for
  , but remains reasonably valid until
  . These are shown as zss and zρmax, respectively, and the location at which branch points form as z0.
Current usage metrics show cumulative count of Article Views (full-text article views including HTML views, PDF and ePub downloads, according to the available data) and Abstracts Views on Vision4Press platform.
Data correspond to usage on the plateform after 2015. The current usage metrics is available 48-96 hours after online publication and is updated daily on week days.
Initial download of the metrics may take a while.