Fig. 3
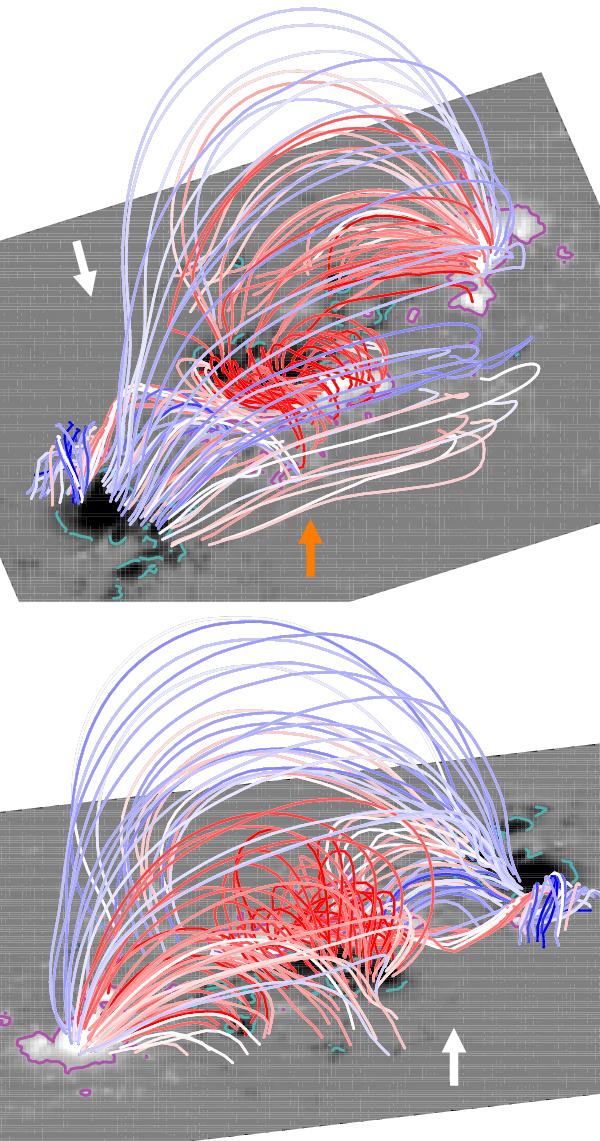
Two 3D views of the NLFFF magnetic field extrapolations with the same selected magnetic field lines as in Fig. 1b. Field lines are colored according to their associated helicity flux density value computed from Eq. (4), red or blue for positive or negative values. The values are saturated at ±1.5 × 10⁸ Wb s-1. Arrows show the viewing angles relative to Fig. 1 (orange) and to the bottom panel (white).
Current usage metrics show cumulative count of Article Views (full-text article views including HTML views, PDF and ePub downloads, according to the available data) and Abstracts Views on Vision4Press platform.
Data correspond to usage on the plateform after 2015. The current usage metrics is available 48-96 hours after online publication and is updated daily on week days.
Initial download of the metrics may take a while.