Fig. 1
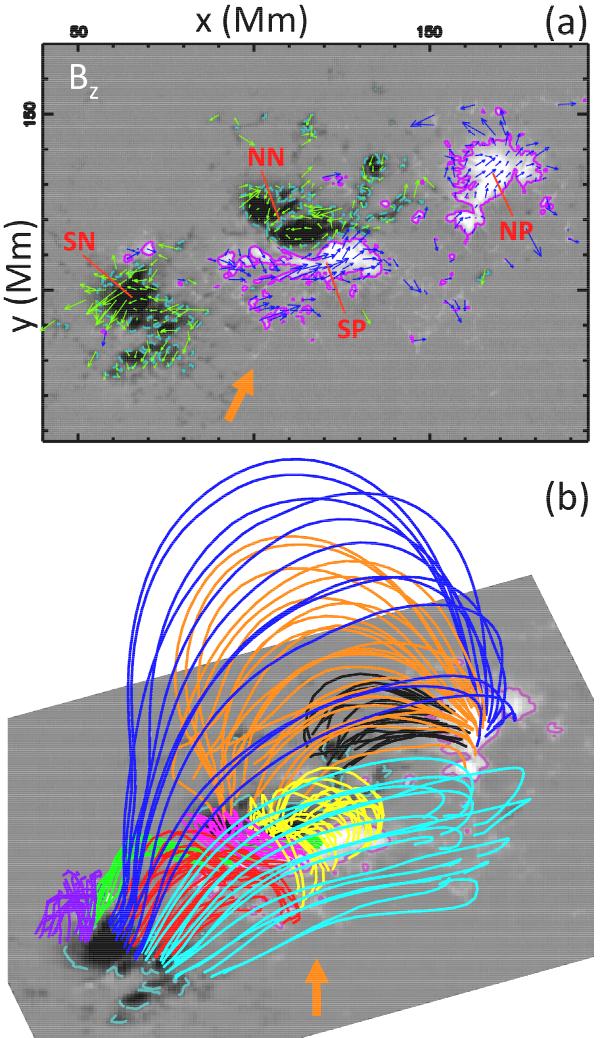
Solar active region NOAA 11158 at ~06:28 UT on 2011 February 14. a) Photospheric vertical magnetic field (Bz) in grayscale overplotted with the flux transport velocity field (blue/green arrows) and the polarity labels (red). b) 3D views of the NLFFF magnetic field extrapolation with selected magnetic field lines. Each field line color corresponds to a different quasi-connectivity domain (separated by QSLs; see Sect. 4). The orange arrow shows the viewing angle relatively to panel a). The magnetic field values are saturated at ±1500 Gauss. Solid pink and dashed cyan lines are ±500 Gauss magnetic field isocontours, respectively.
Current usage metrics show cumulative count of Article Views (full-text article views including HTML views, PDF and ePub downloads, according to the available data) and Abstracts Views on Vision4Press platform.
Data correspond to usage on the plateform after 2015. The current usage metrics is available 48-96 hours after online publication and is updated daily on week days.
Initial download of the metrics may take a while.