| Issue |
A&A
Volume 555, July 2013
|
|
|---|---|---|
| Article Number | L4 | |
| Number of page(s) | 9 | |
| Section | Letters | |
| DOI | https://doi.org/10.1051/0004-6361/201321983 | |
| Published online | 09 July 2013 | |
Inner rings in disc galaxies: dead or alive⋆,⋆⋆
1 University of OuluAstronomy Division, Department of Physics, PO Box 3000, 90014 Oulu, Finland
e-mail: This email address is being protected from spambots. You need JavaScript enabled to view it.
2 Finnish Centre of Astronomy with ESO (FINCA), University of Turku, Väisäläntie 20, 21500 Piikkiö, Finland
Received: 28 May 2013
Accepted: 17 June 2013
Abstract
In this Letter, I distinguish “passive” inner rings as those with no current star formation as distinct from “active” inner rings that have undergone recent star formation. I built a sample of nearby galaxies with inner rings observed in the near- and mid-infrared from the NIRS0S and the S4G surveys. I used archival far-ultraviolet (FUV) and Hα imaging of 319 galaxies to diagnose whether their inner rings are passive or active. I found that passive rings are found only in early-type disc galaxies (−3 ≤ T ≤ 2). In this range of stages, 21 ± 3% and 28 ± 5% of the rings are passive according to the FUV and Hα indicators, respectively. A ring that is passive according to the FUV is always passive according to Hα, but the reverse is not always true. Ring-lenses form 30–40% of passive rings, which is four times more than the fraction of ring-lenses found in active rings in the stage range − 3 ≤ T ≤ 2. This is consistent with both a resonance and a manifold origin for the rings because both models predict purely stellar rings to be wider than their star-forming counterparts. In the case of resonance rings, the widening may be at least partly due to the dissolution of rings. If most inner rings have a resonance origin, I estimate 200 Myr to be a lower bound for their dissolution time-scale. This time-scale is of the order of one orbital period at the radius of inner rings.
Key words: galaxies: evolution / galaxies: kinematics and dynamics / galaxies: spiral / galaxies: statistics
Appendix A is available in electronic form at http://www.aanda.org
Table A.1 is also available at the CDS via anonymous ftp to cdsarc.u-strasbg.fr (130.79.128.5) or via http://cdsarc.u-strasbg.fr/viz-bin/qcat?J/A+A/555/L4
© ESO, 2013
1. Introduction
Gas in disc galaxies is redistributed by angular momentum transfer caused by nonaxisymmetries with a given pattern speed such as bars, ovals, and spiral arms. Some of the gas is collected in orbits near dynamical resonances under the influence of the torques caused by the nonaxisymmetries (for a recent review on barred galaxy dynamics see Athanassoula 2012a). Owing to star formation triggered by the high gas density and by gas travelling in intersecting orbits at each side of the resonance, rings and pseudorings are often formed there (Schwarz 1981, 1984). Historically, this picture has been used to explain resonance rings and pseudorings, but recently an alternative model, called the flux tube manifold theory or manifold theory, postulated that at least some of them are caused by gas and/or stars trapped in tubes of orbits that connect the Lagrangian points at the end of the galaxy bars (Romero-Gómez et al. 2006, 2007; Athanassoula et al. 2009b,a, 2010; Athanassoula 2012b). Another alternative ring formation mechanism is that developed by Kim et al. (2012) for nuclear rings (not studied here), where rings are formed due to the centrifugal barrier encountered by gas migrating to inner regions of the galaxy. In this Letter, the word rings is used to refer to both rings and pseudorings.
In the classical resonance theory and also in the manifold theory, inner rings in barred galaxies have a diameter slightly larger than the bar length. In the classic resonance theory they are associated to the ultraharmonic 4:1 resonance. In this Letter, broad features intermediate between inner lenses and inner rings, called ring-lenses, are accounted for alongside inner rings. Simulations by Rautiainen & Salo (2000) showed that inner rings, although changing in shape and size, are long-lived, provided there is a gas inflow to feed them. In the manifold theory they are also long-lived as long as the galaxy potential does not evolve, or does so slowly (Athanassoula et al. 2010).
“Passive” inner rings are here those not found to host star formation. In the context of nuclear rings, passive rings have also been called fossil rings (Erwin et al. 2001). As opposed to passive features, “active” rings are those with indications of recent star formation. An example of a passive inner ring in the literature is that in NGC 7702 (Buta 1991). Here, I study inner rings identified in two infrared surveys of nearby galaxies, namely the Spitzer Survey of Stellar Structure in Galaxies (S4G; Sheth et al. 2010) and the Near-InfraRed atlas of S0-Sa galaxies (NIRS0S; Laurikainen et al. 2011). The S4G is a survey of 2352 nearby galaxies in 3.6 and 4.5 μm using the Spitzer Space Telescope and NIRS0S is a Ks-band ground-based survey of 206 early-type galaxies. To investigate whether rings are passive or active, I used archival images in one band and one line that trace recent star formation, namely the far-ultraviolet (FUV) and Hα.
This Letter is structured as follows. In Sect. 2, I present the sample, the data, and the image processing. Then, I present the results in Sect. 3 and discuss them in Sect. 4. The conclusions are summarized in Sect. 5.
2. Data selection and processing
I mainly based my sample of galaxies with inner rings on the classification of S4G galaxies made by Buta et al. (in prep.) and statistically studied in the Atlas of Resonance (pseudo)Rings As Known In the S4G (ARRAKIS; Comerón et al., in prep.). Since the S4G sample is biased against galaxies with a small gas fraction, which are mostly elliptical and S0 galaxies, I also included NIRS0S galaxies with inner rings that matched the S4G selection criteria, namely galactic latitude |b| > 30°, radial velocity vr < 4000 km s-1, angular diameter D25 > 1′, and integrated blue magnitude mB < 15.5 mag (data obtained from HyperLeda; Paturel et al. 2003). S4G and NIRS0S data can be mixed safely because the detection of inner rings in the S4G matches that in NIRS0S very well (Sect. 5.10 in ARRAKIS). I also included NGC 2950, an S0 non-S4G galaxy appearing in the same frame as a genuine S4G galaxy which also fulfils the selection criteria.
To avoid dust absorption, ring foreshortening, and poor angular resolution problems, I additionally constrained the sample by only selecting disc galaxies (Hubble stage − 3 ≤ T ≤ 9) with an ellipticity lower than ϵd = 0.5 according to the data of the Pipeline 4 of S4G (Salo et al., in prep.) and with inner rings with a radius larger than 10′′ according to ARRAKIS or NIRS0S. The total number of galaxies fulfilling these conditions is 357.
Two indicators were used to search for recent star formation: the far-ultraviolet continuum and Hα-line emission.
The ultraviolet continuum traces star formation that has occurred in the past 100 Myr (Kennicutt 1998). To study inner rings in that wavelength, I downloaded the deepest available FUV-band image in the GALEX GR6/7 Data Release1 for each galaxy. Such images were available for 319 out of the 357 galaxies initially included in the sample. These 319 galaxies are the final sample I worked with. For 160 galaxies, the FUV images belong to the GALEX All-Sky Imaging Survey (AIS), which consists of ~100 s exposures and can detect point sources down to μAB ~ 20 mag arcsec-2. The other galaxies were imaged in deeper GALEX surveys and were in general exposed for 1000 s or more.
The Hα emission traces star formation that has occurred in the past 20 Myr (Kennicutt 1998). Hα continuum-subtracted images used here come from three sources:
-
Images processed for the Atlas of Images of NUclear Rings(AINUR; Comerónet al. 2010). The images in AINURcome mostly from the Hubble Space Telescope (HST) Archive2.
-
HST images not processed for AINUR. In these cases, Hα narrow-band images and red continuum images were downloaded from the Hubble Legacy Archive3 (HLA) and were used to produce a continuum-subtracted image using the technique described in Knapen et al. (2004, 2006).
-
Continuum-subtracted images in the NASA/IPAC Extragalactic Database (NED)4.
Hα images were available for 139 out of the 319 sample galaxies.
For each sample galaxy I verified in the FUV and Hα continuum-subtracted images whether the rings detected in S4G or NIRS0S images were visible. A detection was considered to be positive if at least a segment of the ring was seen. In some doubtful cases with shallow AIS FUV images, this was only possible after smoothing the image with a Gaussian kernel with a 3-pixel (4.5′′) radius. Positive detections are labelled as “A” for “active” and negative detections are labelled as “P” for “passive” in Table A.1. In doubtful cases, a “?” sign is added to the detection status. From now on, I refer to positive and negative detections as active and passive rings, respectively. This definition means that some rings may be passive in one of the studied indicators but active in the other. Examples of galaxies with passive and active inner rings are shown in Fig. 1. A total of 329 inner rings in the 319 sample galaxies were analysed.
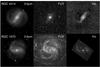 |
Fig. 1 NGC 4314 (top row) is an (R |


3. Results
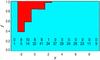 |
Fig. 2 Fraction of active and passive inner rings (blue hatched and red plain surfaces, respectively) according to the FUV indicator as a function of the galaxy stage for galaxies in the sample with available GALEX imaging. The bottom row of numbers indicate the number of active rings for a given stage and the top row indicates the number of those that are passive. |
Fraction of passive rings according to different star formation indicators and for different Hubble stage ranges.
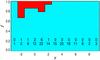 |
Fig. 3 Fraction of active and passive inner rings according to the FUV indicator as in Fig. 2, but now for inner rings in galaxies that have both FUV and Hα imaging available. |
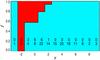 |
Fig. 4 As Fig. 2, but now using Hα emission as an indicator on whether inner rings are passive or active. |
Out of 329 inner rings, 33 were found not to have FUV emission (Fig. 2). All of them are in the stage range − 3 ≤ T ≤ 2. The fraction of passive inner rings in this range of stages according to the FUV star formation indicator is 21 ± 3% with the error bar calculated using binomial statistics. Rings hosted in early-type galaxies are more likely to be passive than those in later types (Table 1). I verified whether non-detections may be partly caused by the use of shallow AIS images by recalculating the statistics with deep GALEX images only (Table 1) and found that the results based on those two samples are compatible within the error bars, which indicates that rings with recent star formation can be detected even in relatively shallow FUV images.
Because Hα imaging is only available for a part of the sample, I reproduced the plot for the FUV inner ring emission in Fig. 2 by using only FUV data that correspond to galaxies for which Hα is available (Fig. 3 and Table 1). This is used below to compare the fraction of passive inner rings according to the FUV and Hα indicators.
Figure 4 and Table 1 show the fraction of passive inner rings according to the Hα indicator. This fraction is equal to or larger than that of passive rings according to the FUV for all stages (28 ± 5% of passive rings in the range −3 ≤ T ≤ 2 where all passive rings are found). This is because none of the rings lacking FUV emission have Hα emission, whereas the reverse is not always true.
While in the range of stages − 3 ≤ T ≤ 2 the fraction of active inner features classified as ring-lenses is one in ten or less, 30–40% of the passive inner features are ring-lenses (Table 2). Regarding inner features that are not classified as ring-lenses, inner closed rings are equally frequent among the passive and the active rings (~30–40%), but pseudorings are less frequent among passive features than among active ones (~30% vs. ~60%).
The passive or active status of a ring does not depend on the family (bar properties) of the host galaxy. Unbarred galaxies (SA) account for ~30% of host galaxies for both passive and active rings in the stage range −3 ≤ T ≤ 2.
4. Discussion
As seen in Sect. 1, two mechanisms have been proposed for the formation of inner rings, namely the resonance and the manifold ones. I consider the resonance mechanism first.
If inner rings are the consequence of the star formation in gas gathered in orbits near resonances, one may expect that once the gas is exhausted, the ring will fade-out and disappear because of two factors. First, bright stars with a low mass-to-light ratio will die after several Myr. Second, radial migration will cause the ring to widen. Both effects would lower the surface brightness of the ring and will tend to make it indistinguishable from the stellar background of the galaxy. Of course, active rings may also have populations of old stars widened by radial migration, but they are likely to be outshone by the regions with recent star formation and thus would appear very sharp.
One piece of evidence that might indicate that rings become wider as they die is that as seen in Table 2, ring-lenses are roughly four times more frequent among passive features than among active features. It is unclear, however, whether the full width of ring-lenses can be explained by the radial migration of stars in passive rings. Alternatively, ring-lenses may form as a response of the old stellar population to the bar potential.
Fraction of passive and active inner features with a given morphology as classified in Buta et al. (in prep.) for different star formation indicators in galaxies with − 3 ≤ T ≤ 2.
Under the assumption that the resonance scenario applies, an estimate of the dissolution time-scale of rings can be made from the data presented here and by knowing that Hα emission outlasts star formation by ~20 Myr and FUV emission outlasts star formation by ~100 Myr (Kennicutt 1998). The subsample of galaxies with both Hα and FUV imaging includes 19 rings without Hα emission. Eleven of those rings have no FUV emission. This means that eight rings stopped forming stars between 20 and 100 Myr ago, and the remainder stopped forming stars longer than 100 Myr ago. Assuming that the fraction of dissolving inner rings has been roughly constant for the past few hundreds of Myr, one can deduce that the ring dissolution time-scale is ~200 Myr. This is a time of the order of an orbital period at the radius of inner rings.
However, this ~200 Myr estimated dissolution time-scale is a lower limit to the true dissolution time-scale. First, rings may form stars intermittently in recurrent episodes. It is therefore reasonable to assume that some of the passive rings may actually be reactivated at some point by some gas inflow. Such periodic activity has been reported in nuclear rings (Allard et al. 2006; Sarzi et al. 2007). Episodic star formation seems more likely in rings that have stopped forming stars more recently (those without Hα emission but with FUV emission), hence the dissolution time-scale underestimation. Second, Hα surveys may be biased against galaxies with little or no Hα emission. This would bias the surveys against galaxies with passive rings, and especially against those that cannot be reactivated, because if the galaxy still has some gas reserve that can be transferred to the ring, some residual star formation may remain elsewhere in the galaxy. As a consequence, the fraction of inner rings without either FUV or Hα emission might be underestimated.
In the framework of the manifold theory, passive rings are not necessarily dissolving. Indeed, manifolds can trap both stars and gas, and for galaxies with little or no gas, purely stellar rings are expected. However, it is still natural to expect passive rings to be wider. Indeed, stars can easily occupy the whole manifold phase space, but gas collisions would cause it (and also the younger generations of stars) to fill a smaller space and thus make the rings appear thinner (Athanassoula et al. 2009b). Whether this effect is enough to explain the full difference in width between regular rings and ring-lenses is not yet explored.
A large fraction of inner rings with a manifold origin could significantly change the dissolution time-scale estimated before. At the moment, no estimate is available on the fraction of inner rings caused by manifolds. Their existence is nearly certain, however, because the characteristic morphology of all types of outer rings, as well as the statistics of the shapes and sizes of both inner and outer rings in nearby galaxies, can be explained by the manifold theory (Athanassoula et al. 2009b, 2010). On the other hand, a set of ~20 N-body simulations with a fixed potential shows that at least in some cases only a minority of ring particles are trapped in manifolds (Rautiainen, priv. comm.). This, however, is not the case for the fully self-consistent simulations of Athanassoula (2012b). Additional study, both observational and numerical, is required to reveal whether manifolds can be easily populated and therefore are a widespread mechanism for shaping galaxy morphology.
In either the resonance or manifold frameworks the lack of passive rings in galaxies with T ≥ 3 is naturally explained because in both cases, gas is available in these late-type galaxies to populate the orbits near resonances and/or the manifold orbits.
5. Conclusions
I used two indicators of recent star formation to check whether inner rings and pseudorings in a set of 319 nearby disc galaxies are passive (without signs of recent star formation) or active (with signs of recent star formation).
I showed that passive rings are only found in galaxies with stages − 3 ≤ T ≤ 2. In that range of stages, 21 ± 3% and 28 ± 5% of rings are passive according to the FUV and Hα indicators, respectively. When a ring is passive in the FUV, it is also passive in Hα, but the reverse is not always true. I found that 30–40% of passive inner rings are classified as ring-lenses in Buta et al. (in prep.). On the other hand, only ~10% of active inner rings in the stage range − 3 ≤ T ≤ 2 are ring-lenses. Although passive rings in both resonance and manifold theories are expected to be wider than their active counterparts, it is still unclear whether these two theories can account for the full transformation of regular inner rings into wide inner ring-lenses.
I estimate that if most inner rings have a resonance origin, a lower boundary for their dissolution time-scale is 200 Myr. This time-scale is of the order of one orbital period at the radius of inner rings.
Online material
Appendix A: Properties of the inner rings in the sample
Properties of the inner rings in the sample.
Acknowledgments
The author thanks the referee, S. Ryder for useful comments. He thanks L. C. Ho, who gave the inspiration for this Letter and P. Rautiainen, H. Salo, J. H. Knapen and E. Athanassoula for useful discussions. This research is based in part on observations made with the Spitzer Space Telescope, which is operated by the Jet Propulsion Laboratory, California Institute of Technology under a contract with NASA. GALEX (Galaxy Evolution Explorer) is a NASA Small Explorer, launched in April 2003. We gratefully acknowledge NASA’s support for construction, operation, and science analysis for the GALEX mission. This research has made use of the NASA/IPAC Extragalactic Database (NED) which is operated by the Jet Propulsion Laboratory, California Institute of Technology, under contract with the National Aeronautics and Space Administration. Based on observations made with the NASA/ESA Hubble Space Telescope, and obtained from the Hubble Legacy Archive, which is a collaboration between the Space Telescope Science Institute (STScI/NASA), the Space Telescope European Coordinating Facility (ST-ECF/ESA) and the Canadian Astronomy Data Centre (CADC/NRC/CSA).
References
- Allard, E. L., Knapen, J. H., Peletier, R. F., & Sarzi, M. 2006, MNRAS, 371, 1087 [NASA ADS] [CrossRef] [Google Scholar]
- Athanassoula, E. 2012a, Proceedings of the XXIII Canary Islands Winter School of Astrophysics: Secular Evolution of Galaxies, eds. J. Falcon-Barroso, & J. H. Knapen (Cambridge University Press) [arXiv:1211.6752] [Google Scholar]
- Athanassoula, E. 2012b, MNRAS, 426, L46 [NASA ADS] [Google Scholar]
- Athanassoula, E., Romero-Gómez, M., Bosma, A., & Masdemont, J. J. 2009a, MNRAS, 400, 1706 [NASA ADS] [CrossRef] [Google Scholar]
- Athanassoula, E., Romero-Gómez, M., & Masdemont, J. J. 2009b, MNRAS, 394, 67 [NASA ADS] [CrossRef] [Google Scholar]
- Athanassoula, E., Romero-Gómez, M., Bosma, A., & Masdemont, J. J. 2010, MNRAS, 407, 1433 [NASA ADS] [CrossRef] [Google Scholar]
- Buta, R. 1991, ApJ, 370, 130 [NASA ADS] [CrossRef] [Google Scholar]
- Comerón, S., Knapen, J. H., Beckman, J. E., et al. 2010, MNRAS, 402, 2462 [NASA ADS] [CrossRef] [Google Scholar]
- Erwin, P., Vega Beltrán, J. C., & Beckman, J. E. 2001, in The Central Kiloparsec of Starbursts and AGN: The La Palma Connection, eds. J. H. Knapen, J. E. Beckman, I. Shlosman, & T. J. Mahoney, ASP Conf. Ser., 249, 171 [Google Scholar]
- Kennicutt, R. C. Jr. 1998, ARA&A, 36, 189 [Google Scholar]
- Kim, W.-T., Seo, W.-Y., Stone, J. M., Yoon, D., & Teuben, P. J. 2012, ApJ, 747, 60 [NASA ADS] [CrossRef] [Google Scholar]
- Knapen, J. H., Whyte, L. F., de Blok, W. J. G., & van der Hulst, J. M. 2004, A&A, 423, 481 [NASA ADS] [CrossRef] [EDP Sciences] [Google Scholar]
- Knapen, J. H., Mazzuca, L. M., Böker, T., et al. 2006, A&A, 448, 489 [NASA ADS] [CrossRef] [EDP Sciences] [Google Scholar]
- Laurikainen, E., Salo, H., Buta, R., & Knapen, J. H. 2011, MNRAS, 418, 1452 [NASA ADS] [CrossRef] [Google Scholar]
- Paturel, G., Petit, C., Prugniel, P., et al. 2003, A&A, 412, 45 [NASA ADS] [CrossRef] [EDP Sciences] [Google Scholar]
- Rautiainen, P., & Salo, H. 2000, A&A, 362, 465 [NASA ADS] [Google Scholar]
- Romero-Gómez, M., Masdemont, J. J., Athanassoula, E., & García-Gómez, C. 2006, A&A, 453, 39 [NASA ADS] [CrossRef] [EDP Sciences] [Google Scholar]
- Romero-Gómez, M., Athanassoula, E., Masdemont, J. J., & García-Gómez, C. 2007, A&A, 472, 63 [NASA ADS] [CrossRef] [EDP Sciences] [Google Scholar]
- Sarzi, M., Allard, E. L., Knapen, J. H., & Mazzuca, L. M. 2007, MNRAS, 380, 949 [NASA ADS] [CrossRef] [Google Scholar]
- Schwarz, M. P. 1981, ApJ, 247, 77 [NASA ADS] [CrossRef] [Google Scholar]
- Schwarz, M. P. 1984, MNRAS, 209, 93 [NASA ADS] [CrossRef] [Google Scholar]
- Sheth, K., Regan, M., Hinz, J. L., et al. 2010, PASP, 122, 1397 [NASA ADS] [CrossRef] [Google Scholar]
All Tables
Fraction of passive rings according to different star formation indicators and for different Hubble stage ranges.
Fraction of passive and active inner features with a given morphology as classified in Buta et al. (in prep.) for different star formation indicators in galaxies with − 3 ≤ T ≤ 2.
All Figures
|
Fig. 1 NGC 4314 (top row) is an (R |
| In the text | |
|
Fig. 2 Fraction of active and passive inner rings (blue hatched and red plain surfaces, respectively) according to the FUV indicator as a function of the galaxy stage for galaxies in the sample with available GALEX imaging. The bottom row of numbers indicate the number of active rings for a given stage and the top row indicates the number of those that are passive. |
| In the text | |
|
Fig. 3 Fraction of active and passive inner rings according to the FUV indicator as in Fig. 2, but now for inner rings in galaxies that have both FUV and Hα imaging available. |
| In the text | |
|
Fig. 4 As Fig. 2, but now using Hα emission as an indicator on whether inner rings are passive or active. |
| In the text | |
Current usage metrics show cumulative count of Article Views (full-text article views including HTML views, PDF and ePub downloads, according to the available data) and Abstracts Views on Vision4Press platform.
Data correspond to usage on the plateform after 2015. The current usage metrics is available 48-96 hours after online publication and is updated daily on week days.
Initial download of the metrics may take a while.