Fig. 7
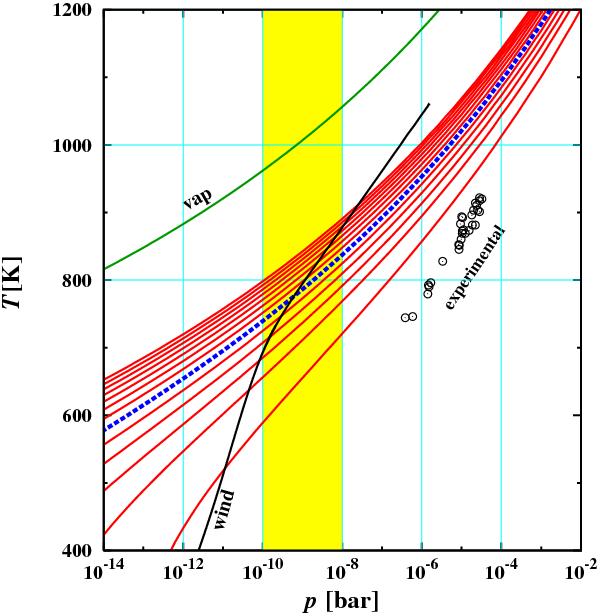
Lines of constant nucleation rate per H-nucleus according to the numerical fit to the experimental data. The red lines correspond to values of J/NH from 10-34 s-1 (top) to 10-10 (bottom) in steps of 102. The shaded area indicates the range of pressures typically encountered at the inner edge of dust shells. The thick dashed (blue) line corresponds to the critical nucleation rate of J/NH = 10-20 particles cm-3 s-1 where massive dust nucleation commences under circumstellar conditions. The uppermost (green) line corresponds to the stability limit if solid SiO is in equilibrium with a gas with standard cosmic elemental abundances. The line denoted as “wind” corresponds to the p-T-trajectory of a wind model. The circles correspond to the data points of the laboratory experiments, if the pressure of SiO in the condensation zone is converted into an equivalent pressure of a gas with cosmic elemental composition.
Current usage metrics show cumulative count of Article Views (full-text article views including HTML views, PDF and ePub downloads, according to the available data) and Abstracts Views on Vision4Press platform.
Data correspond to usage on the plateform after 2015. The current usage metrics is available 48-96 hours after online publication and is updated daily on week days.
Initial download of the metrics may take a while.