| Issue |
A&A
Volume 555, July 2013
|
|
|---|---|---|
| Article Number | L1 | |
| Number of page(s) | 5 | |
| Section | Letters | |
| DOI | https://doi.org/10.1051/0004-6361/201321681 | |
| Published online | 02 July 2013 | |
Nebular emission and the Lyman continuum photon escape fraction in CALIFA early-type galaxies⋆
1
Centro de Astrofísica and Faculdade de Ciências, Universidade do
Porto, Rua das
Estrelas, 4150-762
Porto,
Portugal
e-mail: This email address is being protected from spambots. You need JavaScript enabled to view it.
2
Instituto de Astrofísica de Andalucía (CSIC),
Glorieta de la Astronomía s/n Aptdo.
3004, 18080
Granada,
Spain
3
GEPI, Observatoire de Paris, UMR 8111, CNRS, Université Paris
Diderot, 5 place Jules
Janssen, 92190
Meudon,
France
4
University of Vienna, Türkenschanzstrasse 17, 1180
Vienna,
Austria
5
Centro Astronómico Hispano Alemán de Calar Alto (CSIC-MPG), C/
Jesús Durbán Remón 2-2, 4004
Almería,
Spain
6
Leibniz-Institut für Astrophysik Potsdam (AIP),
An der Sternwarte 16,
14482
Potsdam,
Germany
7 Sydney Institute for Astronomy, University of Sydney, NSW
2006, Australia
8 School of Physics and Astronomy, University of St Andrews,
North Haugh, St Andrews, KY16 9SS, UK ( SUPA )
9
Instituto de Astrofísica de Canarias, Vía Láctea s/n, 38205 La Laguna, Tenerife, Spain
10
Departamento de Astrofísica, Universidad de La
Laguna, 38205, La
Laguna, Tenerife,
Spain
11
CENTRA – Centro Multidisciplinar de Astrofísica, Instituto
Superior Técnico, Av. Rovisco Pais
1, 1049-001
Lisbon,
Portugal
12
Australian Astronomical Observatory, PO Box 915, North Ryde, NSW
1670,
Australia
13 Department of Physics and Astronomy, Macquarie University,
NSW 2109, Australia
14
Departamento de Investigación Básica, CIEMAT, Avda. Complutense 40, 28040
Madrid,
Spain
15
Max-Planck-Institut für Astronomie, Königstuhl 17, 69117
Heidelberg,
Germany
Received: 11 April 2013
Accepted: 2 June 2013
Abstract
We use deep integral field spectroscopy data from the CALIFA survey to study the warm interstellar medium (wim) over the entire extent and optical spectral range of 32 nearby early-type galaxies (ETGs). We find that faint nebular emission is extended in all cases, and its surface brightness decreases roughly as ∝ r−α. The large standard deviation in the derived α (1.09 ± 0.67) argues against a universal power-law index for the radial drop-off of nebular emission in ETGs. Judging from the properties of their extranuclear component, our sample ETGs span a broad, continuous sequence with respect to their α, Hα equivalent width (EW) and Lyman continuum (Lyc) photon leakage fraction (plf). We propose a tentative subdivision into two groups: Type i ETGs are characterized by rather steep Hα profiles (α ≃ 1.4), comparatively large (≳1 Å), nearly radially constant EWs, and plf ≃ 0. Photoionization by post-AGB stars appears to be the main driver of extended nebular emission in these systems, with nonthermal sources being potentially important only in their nuclei. Typical properties of type ii ETGs are shallower Hα profiles (α ≃ 0.8), very low (≲0.5 Å) EWs with positive radial gradients, and a mean plf ≳ 0.7, rising to ≳0.9 in their centers. Such properties point to a low, and inwardly decreasing wim density and/or volume filling factor. We argue that, because of extensive Lyc photon leakage, emission-line luminosities and EWs are reduced in type ii ETG nuclei by at least one order of magnitude. Consequently, the line weakness of these ETGs is by itself no compelling evidence for their containing merely “weak”(sub-Eddington accreting) active galactic nuclei (AGN). In fact, Lyc photon escape, which has heretofore not been considered, may constitute a key element in understanding why many ETGs with prominent signatures of AGN activity in radio continuum and/or X-ray wavelengths show only faint emission lines and weak signatures of AGN activity in their optical spectra. The Lyc photon escape, in conjunction with dilution of nuclear EWs by line-of-sight integration through a triaxial stellar host, can systematically impede detection of AGN in gas-poor galaxy spheroids through optical emission-line spectroscopy, thereby leading to an observational bias. We further find that type i&ii ETGs differ little (≲0.4 dex) in their mean BPT line ratios, which in both cases are characteristic of LINERs and are, within their uncertainties, almost radius-independent. This potentially hints at a degeneracy of the projected, luminosity-weighted BPT ratios in the LINER regime, for the specific 3D properties of the wim and the ionizing photon field in ETGs.
Key words: galaxies: elliptical and lenticular, cD / galaxies: nuclei / galaxies: ISM
Based on observations collected at the Centro Astronómico Hispano Alemán (CAHA) at Calar Alto, operated jointly by the Max-Planck-Institut für Astronomie (MPIA) and the Instituto de Astrofísica de Andalucía (CSIC).
© ESO, 2013
1. Introduction
Even though the presence of faint nebular emission (ne) in the nuclei of many early-type galaxies (ETGs) has long been established observationally (e.g., Phillips et al. 1986; Sarzi et al. 2006, 2010; Annibali et al. 2010; Kehrig et al. 2012, hereafter K12), the nature of the dominant excitation mechanism of the warm interstellar medium (wim) in these systems remains uncertain. The low-ionization nuclear emission-line region (LINER) emission-line ratios, as a typical property of ETG nuclei, have prompted various interpretations (see, e.g., K12, Yan & Blanton 2012), including low-accretion rate active galactic nuclei (AGN; e.g., Ho 1999), fast shocks (e.g. Dopita & Sutherland 1995), and hot, evolved (≥ 108 yr) post-AGB (pAGB) stars (e.g., Trinchieri & di Serego Alighieri 1991; Binette et al. 1994; Stasińska et al. 2008). Since each of these mechanisms is tied to distinct and testable expectations on the 2D properties of the wim, the limited spatial coverage of previous single-aperture and longslit spectroscopic studies has been an important obstacle to any conclusive discrimination between them. Spatially resolved integral field spectroscopy (IFS) over the entire extent of ETGs offers an essential advantage in this respect and promises key observational constraints toward the resolution of this longstanding debate.
This Letter gives a brief summary of our results from an ongoing study of 32 ETGs, which were mapped with deep IFS over their entire extent and optical spectral range with the goal of gaining deeper insight into the 2D properties of their wim. A detailed discussion of individual objects and our methodology will be given in Gomes et al. (in prep.; hereafter G13) and subsequent publications of this series. This study is based on low-spectral-resolution (R ~ 850) IFS cubes for 20 E and 12 S0 nearby (<150 Mpc) galaxies from the Calar Alto Legacy Integral Field Area (CALIFA) survey (Sánchez et al. 2012; Walcher et al., in prep.). These data are being made accessible to the community in a fully reduced and well-documented format (Husemann et al. 2013) through successive data releases.
2. Methodology and results
The CALIFA data cubes were processed with the Porto3D pipeline (see K12 and G13 for details), which, among various other tasks, permits spaxel-by-spaxel spectral fitting of the stellar component with the population synthesis code starlight (Cid Fernandes et al. 2005) and subsequent determination of emission line fluxes and their uncertainties from the pure emission-line spectrum (i.e. the observed spectrum after subtraction of the best-fitting synthetic stellar model). For each ETG, typically ~1600 to ~3400 individual spectra with a S/N ≥ 30 at 5150 Å were extracted and modeled in the spectral range 4000–6800 Å using both Bruzual & Charlot (2003, hereafter BC) and MILES (Sánchez-Blázquez et al. 2006; Vazdekis et al. 2010) simple-stellar population (SSP) libraries, which comprise 34 ages between 5 Myr and 13 Gyr for three metallicities (0.008, 0.019, and 0.03), i.e., 102 elements each. After full analysis and cross-inspection of the relevant output from the BC- and MILES-based models, the emission-line maps for each ETG were error-weighted and averaged spaxel-by-spaxel to reduce uncertainties.
An extra module in Porto3D permits computation of the Lyman continuum (Lyc) ionizing photon rate corresponding to the best-fitting set of BC SSPs for each spaxel. The Lyc output is then converted into Balmer line luminosities assuming case B recombination for an electron temperature and density of 104 K and 100 cm-3, respectively. The same module computes the distance-independent τ ratio of the Hα luminosity predicted from pAGB photoionization to the one observed (see Binette et al. 1994; Cid Fernandes et al. 2011, for equivalent quantities). The latter is optionally corrected for intrinsic extinction, assuming this to be equal to the extinction AV in the stellar component (cf. K12 and G13). Since spectral fits imply a low (≤ 0.3 mag) AV in most cases, this correction typically has a weak effect on τ. We preferred to not base corrections of the τ ratio on nebular extinction estimates since these are consistent with AV within their uncertainties.
We note that state-of-the-art SSP models imply that the Lyc photon rate per unit mass from pAGB stellar populations of nearly solar metallicity (0.008 ≲ Z ≲ 0.03) is almost independent of age, metallicity, and star formation history (e.g. Cid Fernandes et al. 2011, G13). However, substantial uncertainties stem from the fact that existing models differ from one another by a factor ~2 in the mean Lyc output they predict for the pAGB stellar component (Cid Fernandes et al. 2011; see also, e.g., Brown et al. 2008; and Woods & Gilfanov 2013, for a discussion related to this subject). These theoretical uncertainties presumably prevent a determination of the τ ratio to a precision better than within a factor of ~2 from currently available SSP models.
Our analysis in Sects. 2.1 and 2.2 uses two complementary data sets: i) single-spaxel (sisp) determinations from fits with an absolute deviation |Oλ − Mλ|/Oλ ≤ 2.6 (cf. K12), where Oλ is the observed spectrum and Mλ the fit. These are typically restricted to the central, brightest part (μ ≲ 23 g mag/◻″) of our sample ETGs. ii) The average of all single-spaxel determinations within isophotal annuli (isan) adapted to the morphology of the (line-free) continuum between 6390 Å and 6490 Å (cf K12). These data, which are to be considered in a statistical sense, go ≳2 mag fainter, allowing study of the azimuthally averaged properties of the wim in the ETG periphery.
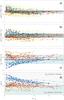 |
Fig. 1 From top to bottom: log ([O iii]/Hβ), log ([N ii]/Hα), log (EW(Hα)), and log (τ) vs normalized photometric radius R⋆/rp. The gray shaded areas in panels a&b mark the mean and ± 1σ of the respective quantity, and in panel c the mean EW(Hα) for R⋆ ≥ rp (0.43 ± 0.65 Å). The light-blue area in panel c depicts the range in EW(Hα) that can be accounted for by pAGB photoionization models (0.1–2.4 Å). The color assigned to each ETG is related to its ⟨τ⟩ (cf. text and Fig. 3) in ascending order, from orange to violet, and is identical in all figures. |
2.1. Radial behavior of emission-line diagnostics
Figures 1a, b show the diagnostic log ([O iii]/Hβ) and log ([N ii]/Hα) line ratios for our sample ETGs as a function of the photometric radius R⋆, normalized to the SDSS r band Petrosian_50 radius rp. The profiles are based on isan determinations, with green error bars illustrating the 1σ dispersion (typically ~0.4 dex) of single-spaxel data points within each annulus. All galaxies show LINER-specific Baldwin et al. (1981, BPT) ratios out to their periphery, with weak (if any) gradients solely within their central part (R⋆ ≲ rp). The mean ratios for our sample (shaded regions) were determined to be 0.37 ± 0.13 for log ([O iii]/Hβ) and 0.34 ± 0.26 for log ([N ii]/Hα), with a standard deviation about the mean σN of 0.02 and 0.05.
The EW(Hα) profiles (panel c) reveal a more complex pattern. For R⋆ ≳ rp, most data points fall between 0.1 Å (EW ) and 2.4 Å (EW
 ), in the range of predictions from pAGB photoinization models (e.g., Binette et al. 1994; Cid Fernandes et al. 2011, G13), whereas at smaller radii the sample seems to diverge into a lower (≲ EW) and upper (≳EW) branch.
The τ ratio profiles (panel d) include correction for intrinsic extinction, with vertical bars illustrating the effect that neglecting it would have. The reference line at log (τ) = 0 corresponds to an equilibrium state where the Lyc photon output from pAGB stars balances the observed Hα luminosity. Values below (log (τ) < 0) or above (log (τ) > 0) that line imply, in the first case, Lyc photon injection by an additional source (e.g., star formation, AGN, shocks) and, in the second, Lyc photon escape with a photon leakage fraction plf = 1 − τ-1.
Setting a tentative division line at a radially averaged ⟨τ ⟩ = 2, we can see that our ETG sample segregates into two groups. In the first one (type i; ⟨τ ⟩ < 2, 14 ETGs), the τ ratio shows little dependence on radius, with individual data points deviating in most cases by no more than 0.3 dex from the equality line. This suggests a moderate Lyc leakage (plf ≤ 0.5) and/or dominant contribution of pAGB photoinization to the excitation of the wim. In the second group (type ii; ⟨τ ⟩ ≥ 2, 18 ETGs), the plf is typically very large (≳0.9) within rp, and far from negligible (≳0.6) even in the galaxy periphery. As is apparent from panel c, these two groups differ in their EW(Hα), with radially averaged values ⟨EW⟩ of 1.82 ± 1.04 Å (σN = 0.28 Å) and 0.41 ± 0.25 Å (σN = 0.06 Å). Another salient feature is that EW profiles of type i ETGs are nearly constant beyond ~rp/2, whereas those of type ii ETGs show a tendency toward a smooth, monotonic increase out to their periphery.
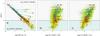 |
Fig. 2 a)–c) log (EW(Hα)), log ([O iii]/Hβ) and log ([N ii]/Hα) vs. log (τ) for our sample ETGs. Open squares mark the central value for each isan profile (interconnected symbols), and dots show sisp determinations. |
Figures 2a−c display projections of some quantities of interest onto τ. Unsurprisingly, both sisp and isan data delineate a trend toward decreasing EW(Hα) with increasing τ, with type i and type ii ETGs populating, respectively, the lower and upper parts of a continuous sequence (panel a). This trend is also reflected on a relation log ⟨ τ ⟩ = (0.23 ± 0.04)−(1.36 ± 0.09)log ⟨ EW(Hα)⟩ for our sample (cf. right-hand side list in Fig. 3 for the ⟨τ⟩ and ⟨EW⟩ of individual ETGs). On the log ([O iii]/Hβ) vs. log (τ) plane (panel b), the two ETG groups differ only marginally from one another (log ([O iii]/Hβ) of 0.29 ± 0.11 and 0.43 ± 0.12), while a weak trend toward increasing log ([N ii]/Hα) with log (τ) is apparent from panel c (0.11 ± 0.13 and 0.52 ± 0.17 for type i and type ii ETGs, respectively).
2.2. Radial intensity distribution of nebular emission
The radial Hα intensity profiles in Fig. 3 indicate that faint ne is present over nearly the entire optical extent of our sample ETGs. From the Abel integral equation (see, e.g., Papaderos et al. 1996, for a discussion and solutions for various intensity profiles) it follows that, for an isotropically emitting spheric-symmetric volume, an intrinsic luminosity density distribution l(r) scaling as ∝ r-2 would be projected onto a power-law intensity profile of the form log (I/I0) ∝ − αlog (R ⋆ ) with α = 1. On the simplifying assumption that the Lyc output from a putative AGN is internally reprocessed into ne with a l(r) ∝ r-2, one can invoke the α inferred from Hα profile fitting as a minimum consistency check for the AGN illumination hypothesis. The mean α for our sample (1.09), obtained for R⋆ ≥ 3 7 (the effective FWHM resolution of CALIFA IFS cubes) is indeed consistent with it and close to the value deduced by Yan & Blanton (2012, α = 1.28 from comparison of two-aperture spectroscopic data. Nevertheless, the large standard deviation in the derived slopes (σ = 0.67) argues against a universal power-law index α ≈ 1 for the ne intensity drop-off in ETGs. It is interesting though that comparison of Figs. 1 and 3 suggests a tendency for type ii ETGs having shallower Hα profiles (α = 0.85 ± 0.56; σN = 0.13) than type i ETGs (α = 1.40 ± 0.67; σN = 0.18).
3. Discussion and conclusions
Summarizing the evidence from Sect. 2, the ETGs studied here form a broad, continuous sequence with respect to their Hα, EW(Hα), and τ profiles. Adopting a radially averaged τ ratio cutoff of ⟨τ ⟩ = 2, we tentatively subdivide our sample into two groups: typical properties of type i ETGs are a rather steep Hα drop-off (α > 1), nearly constant EWs of ≳1 Å beyond rp, and a ⟨τ⟩ close to unity (0.3...2). Type ii ETGs display shallower Hα profiles (α < 1), overall very low (≲EW...0.5 Å), outwardly increasing EWs, and a large (up to ~20) ⟨τ ⟩ . Despite a difference of almost 2 dex in their nuclear τ ratios, these two groups differ little (by ≲0.4 dex) in their mean log ([O iii]/Hβ) and log ([N ii]/Hα) BPT ratios, which in either case are characteristic of LINERs and, within their uncertainties (~0.4 dex), are radially constant. In our ETG sample, 64% of the S0 galaxies fall into the type i group, and 78% of the E galaxies fall into the type ii group. Clearly, the classification proposed here is only indicative and needs to be refined, both by obtaining better statistics and through a quantitative comparison with other ETG properties: of these, the X-ray luminosity and temperature, the α4 and (v/σ) ⋆ parameter, and the star formation history are all being actively investigated.
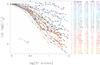 |
Fig. 3 Normalized Hα intensity vs log (R ⋆ ) for our sample ETGs, based on isan determinations. The diagonal lines correspond to a power-law intensity drop-off of the form log (I/I0) ∝ − αlog (R ⋆ ), with α = 1. The right-hand side table lists the power-law slope α and the radially averaged EW(Hα) and τ for each ETG. |
As far as type i ETGs are concerned, various lines of evidence from this study suggest, in line with a substantial body of previous work (e.g. Sarzi et al. 2010; Annibali et al. 2010; Yan & Blanton 2012, K12, among others), that pAGB photoinization is the main driver of extended ne, with nonthermal sources only being potentially important in nuclei: a) First, ne is not confined only to the nuclear regions but is extended out to R⋆ ~ 2–4rp, i.e. is co-spatial with the pAGB stellar background. b) Second, radial Hα profiles rule out a power-law intensity drop-off with a universal slope α ≈ 1, as a possible signature of a dominant AGN contribution to the excitation of the wim. c) Third, the EW(Hα) is nearly constant beyond ~rp, pointing to a causal relationship between ne and the projected stellar surface density Σ ⋆ along the line of sight. This is a plausible expectation from the pAGB photoinization scenario, further supported by the quantitative agreement between predicted and observed EWs, as well as the narrow range in τ ratios (≃ 1). These presumably suggest that type i ETGs contain a sufficient amount of wim being well mixed with stars, to justify case B recombination as a first-order approximation. Conversely, it is not immediately apparent how AGN or shock excitation alone could lead to the remarkable fine tuning between EW(Hα) and Σ ⋆ over ≳2 dex in Σ ⋆ .
The emerging picture for type ii ETGs appears more complex. The τ ratios inferred for these systems imply at face value that the bulk (70%... ≳90%) of the Lyc output from hot pAGB stars (consequently, from any other discrete or diffuse ionizing source) escapes into the intergalactic space without being reprocessed into ne. Admittedly, plf estimates depend on the pAGB mass inferred from spectral synthesis models. These are known to suffer from degeneracies, the amplitude, topology, and systematics of which remain almost uncharted territory. One might argue that the large number of fits per galaxy (up to ~6800, using two SSP libraries) permits eliminating uncertainties, at least as far as isan determinations are concerned. However, this argument would only apply if errors in spectral synthesis were uncorrelated and nonsystematic.
Nevertheless, in the specific context of type ii ETGs, an essentially model-independent argument for extensive Lyc leakage comes from the virtual absence of ne, despite a sizeable ionizing photon budget. Quantitatively, for the Lyc escape interpretation to become untenable, Hα fluxes in type ii ETGs would need be revised upward by up to two orders of magnitude, which can be excluded by any reasonable error budget.
The τ profiles of these ETGs consistently point toward a low, radially dependent volume-filling factor f and/or density for the wim. A further hint in the same direction comes from their positive EW gradients: For a spheric-symmetric volume, these in connection with shallow (α < 1) Hα profiles are only reproducible when the wim luminosity density is monotonically decreasing toward the center. Alternatively, a feature predicted (though not observed) by Sarzi et al. (2010, see their Fig. 10) are positive EW gradients in a spherical stellar host reprocessing its pAGB Lyc output within a planar gas configuration. Expanding the considerations by these authors, the high plf’s and outwardly increasing EWs of type ii ETGs might be reconcilable for a geometry that involves an oblate distribution of tenuous/clumpy gas within a spherical stellar host. Evidently, such a geometry would per se imply pAGB UV photon escape, further reinforcing our interpretation.
Regardless of the 3D distribution of the wim, its high porosity and/or low f call into question the importance of shock excitation in type ii ETGs. If the wim is primarily composed of compact cloudlets of radius rc, then their large mean-free-path ((2/3) rc/f, e.g., Jog & Solomon 1992) would act toward reducing the efficiency of energy dissipation via cloud-cloud collisions and shocks.
Given our findings, it is important to ask whether the “weak” AGN interpretation of the optical emission lines is compelling anymore. In the presence of extensive Lyc leakage, emission-line intensities and EWs in type ii ETG nuclei are lowered by factor between ~10 and ≲100. Consequently, the presence of weak ne in these systems is not in itself proof of a “weak” (sub-Eddington accreting) AGN. In fact, the importance of Lyc photon escape, which heretofore has not been investigated in detail, may be a key insight into resolving one of the longstanding enigmas in AGN/LINER research. It offers an ansatz for reconciling the fact that many ETGs with prominent signatures of strong AGN activity in radio continuum and/or X-ray wavelengths merely show weak (LINER) optical AGN signatures.
In addition, the relative distribution of gas compared to the stars is an important issue. While in a thin, face-on disk, a nuclear EW of, say, ≲10 Å can safely be regarded as evidence of faint ne (and a weak AGN), this is not necessarily the case for a triaxial ETG, where the ne-emitting gas volume may have a more limited extent than the stellar component. In the latter case, nuclear EWs are effectively lowered by the high-surface brightness screen of background and foreground stars along the optical path. In conjunction with the Lyc photon escape, this line-of-sight dilution of the nuclear EWs will conspire to create an observational selection effect, favoring optical detection of AGN activity in oblate, face-on ETGs with atypically low plf’s.
Arguably, one of the most surprising results of this study are the similar mean BPT ratios of type i and type ii ETGs, despite having substantial differences in their wim characteristics. Perhaps the luminosity-weighted emission-line ratios projected along the line of sight “saturate” into the LINER regime for a broad range of wim distributions and characteristics (i.e. combinations of differing f, covering fractions, densities, ionizing photon mean free-path, and ionization parameters), becoming degenerate for ETGs. Circumstantial support for this hypothesis comes from radiation transfer models by Ercolano et al. (2012), who report that a subset of the projected emission line ratio determinations in a 3D model of the Pillars of Creation can mimic LINER characteristics in classical (1D) BPT diagrams. Clearly, detailed 3D radiative transfer modeling of the wim in ETGs, including nonequilibrium ionization effects (e.g., de Avillez & Breitschwerdt 2012), are important for understanding the nature of wim in ETGs. High-quality IFS data, such as those from CALIFA, will no doubt provide crucial observational constraints on these next-generation models.
Acknowledgments
We thank the anonymous referee for valuable suggestions. This paper is based on data from the Calar Alto Legacy Integral Field Area Survey, CALIFA (http://califa.caha.es), funded by the Spanish Ministery of Science under grant ICTS-2009-10, and the Centro Astronómico
Hispano-Alemán. PP is supported by Ciencia 2008 Contract, funded by FCT/MCTES (Portugal) and POPH/FSE (EC), and J.M.G. by a Post-Doctoral grant, funded by FCT/MCTES (Portugal) and POPH/FSE (EC). P.P. and J.M.G. acknowledge support by the Fundação para a Ciência e a Tecnologia (FCT) under project FCOMP-01-0124-FEDER-029170 (Reference FCT PTDC/FIS-AST/3214/2012), funded by FCT-MEC (PIDDAC) and FEDER (COMPETE). I.M. acknowledges support from Spanish grant AYA2010-15169 and the Junta de Andalucia through TIC-114 and the Excellence Project P08-TIC-03531. J.F.-B. from the Ramón y Cajal Program, grants AYA2010-21322-C03-02 and AIB-2010-DE-00227 from the Spanish Ministry of Economy and Competitiveness (MINECO), as well as from the FP7 Marie Curie Actions of the European Commission, via the Initial Training Network DAGAL under REA grant agreement n° 289313. The starlight project is supported by the Brazilian agencies CNPq, CAPES, and FAPESP. PP has enjoyed inspiring discussions on the effects of Lyc photon leakage with Prof. Nils Bergvall (Uppsala University). We benefited from stimulating discussions with several members of the CALIFA collaboration. This research made use of the NASA/IPAC Extragalactic Database (NED) which is operated by the Jet Propulsion Laboratory, California Institute of Technology, under contract with the National Aeronautics and Space Administration.
References
- Annibali, F., Bressan, A., Rampazzo, R., et al. 2010, A&A, 519, A40 [NASA ADS] [CrossRef] [EDP Sciences] [Google Scholar]
- Baldwin, J. A., Phillips, M. M., & Terlevich, R. 1981, PASP, 93, 5 [NASA ADS] [CrossRef] [EDP Sciences] [Google Scholar]
- Binette, L., Magris, C. G., Stasińska, G., & Bruzual, A. G. 1994, A&A, 292, 13 [NASA ADS] [Google Scholar]
- Brown, T. M., Smith, E., Ferguson, H. C., et al. 2008, ApJ, 682, 319 [NASA ADS] [CrossRef] [Google Scholar]
- Bruzual, G., & Charlot, S. 2003, MNRAS, 344, 1000 [NASA ADS] [CrossRef] [Google Scholar]
- Cid Fernandes, R., Mateus, A., Sodré, L., et al. 2005, MNRAS, 358, 363 [NASA ADS] [CrossRef] [Google Scholar]
- Cid Fernandes, R., Stasińska, G., Mateus, A., et al. 2011, MNRAS, 413, 1687 [NASA ADS] [CrossRef] [Google Scholar]
- de Avillez, M. A., & Breitschwerdt, D. 2012, ApJ, 756, L3 [NASA ADS] [CrossRef] [Google Scholar]
- Ercolano, B., Dale, J. E., Gritschneder, M., et al. 2012, MNRAS, 420, 141 [NASA ADS] [CrossRef] [Google Scholar]
- Dopita, M. A., & Sutherland, R. S. 1995, ApJ, 455, 468 [NASA ADS] [CrossRef] [Google Scholar]
- Ho, L. C. 1999, Adv. Space Res., 23, 813 [NASA ADS] [CrossRef] [Google Scholar]
- Husemann, B., Jahnke, K., Sánchez, S. F., et al. 2013, A&A, 549, A87 [NASA ADS] [CrossRef] [EDP Sciences] [Google Scholar]
- Jog, C. J., & Solomon, P. M. 1992, ApJ, 387, 152 [NASA ADS] [CrossRef] [Google Scholar]
- Kehrig, C., Monreal-Ibero, A., Papaderos, P., et al. 2012, A&A, 540, A11 (K12) [NASA ADS] [CrossRef] [EDP Sciences] [Google Scholar]
- Papaderos, P., Loose, H.-H., Thuan, T. X., & Fricke, K. J. 1996, A&AS, 120, 207 [NASA ADS] [CrossRef] [EDP Sciences] [Google Scholar]
- Phillips, M. M., Jenkins, C. R., Dopita, M. A., et al. 1986, AJ, 91, 1062 [NASA ADS] [CrossRef] [Google Scholar]
- Sánchez, S. F., Kennicutt, R. C., Gil de Paz, A., et al. 2012, A&A, 538, A8 [NASA ADS] [CrossRef] [EDP Sciences] [Google Scholar]
- Sánchez-Blázquez, P., Peletier, R. F., Jiménez-Vicente, J., et al. 2006, MNRAS, 371, 703 [NASA ADS] [CrossRef] [Google Scholar]
- Sarzi, M., Falcón-Barroso, J., Davies, R. L., et al. 2006, MNRAS, 366, 1151 [NASA ADS] [CrossRef] [Google Scholar]
- Sarzi, M., Shields, J. C., Schawinski, K., et al. 2010, MNRAS, 402, 2187 [NASA ADS] [CrossRef] [Google Scholar]
- Stasińska, G., Vale Asari, N., Cid Fernandes, R., et al. 2008, MNRAS, 391, L29 [NASA ADS] [Google Scholar]
- Trinchieri, G., & di Serego Alighieri, S. 1991, AJ, 101, 1647 [NASA ADS] [CrossRef] [Google Scholar]
- Vazdekis, A., Sánchez-Blázquez, P., Falcón-Barroso, J., et al. 2010, MNRAS, 404, 1639 [NASA ADS] [Google Scholar]
- Woods, T. E., & Gilfanov, M. 2013, MNRAS, 432, 1640 [NASA ADS] [CrossRef] [Google Scholar]
- Yan, R., & Blanton, M. R. 2012, ApJ, 747, 61 [NASA ADS] [CrossRef] [Google Scholar]
All Figures
|
Fig. 1 From top to bottom: log ([O iii]/Hβ), log ([N ii]/Hα), log (EW(Hα)), and log (τ) vs normalized photometric radius R⋆/rp. The gray shaded areas in panels a&b mark the mean and ± 1σ of the respective quantity, and in panel c the mean EW(Hα) for R⋆ ≥ rp (0.43 ± 0.65 Å). The light-blue area in panel c depicts the range in EW(Hα) that can be accounted for by pAGB photoionization models (0.1–2.4 Å). The color assigned to each ETG is related to its ⟨τ⟩ (cf. text and Fig. 3) in ascending order, from orange to violet, and is identical in all figures. |
| In the text | |
|
Fig. 2 a)–c) log (EW(Hα)), log ([O iii]/Hβ) and log ([N ii]/Hα) vs. log (τ) for our sample ETGs. Open squares mark the central value for each isan profile (interconnected symbols), and dots show sisp determinations. |
| In the text | |
|
Fig. 3 Normalized Hα intensity vs log (R ⋆ ) for our sample ETGs, based on isan determinations. The diagonal lines correspond to a power-law intensity drop-off of the form log (I/I0) ∝ − αlog (R ⋆ ), with α = 1. The right-hand side table lists the power-law slope α and the radially averaged EW(Hα) and τ for each ETG. |
| In the text | |
Current usage metrics show cumulative count of Article Views (full-text article views including HTML views, PDF and ePub downloads, according to the available data) and Abstracts Views on Vision4Press platform.
Data correspond to usage on the plateform after 2015. The current usage metrics is available 48-96 hours after online publication and is updated daily on week days.
Initial download of the metrics may take a while.