Fig. 1
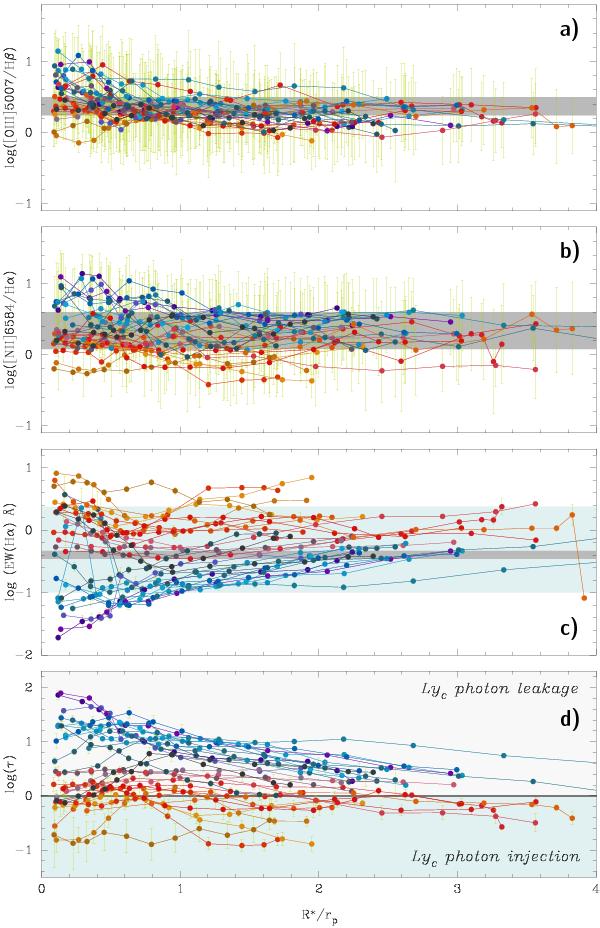
From top to bottom: log ([O iii]/Hβ), log ([N ii]/Hα), log (EW(Hα)), and log (τ) vs normalized photometric radius R⋆/rp. The gray shaded areas in panels a&b mark the mean and ± 1σ of the respective quantity, and in panel c the mean EW(Hα) for R⋆ ≥ rp (0.43 ± 0.65 Å). The light-blue area in panel c depicts the range in EW(Hα) that can be accounted for by pAGB photoionization models (0.1–2.4 Å). The color assigned to each ETG is related to its ⟨τ⟩ (cf. text and Fig. 3) in ascending order, from orange to violet, and is identical in all figures.
Current usage metrics show cumulative count of Article Views (full-text article views including HTML views, PDF and ePub downloads, according to the available data) and Abstracts Views on Vision4Press platform.
Data correspond to usage on the plateform after 2015. The current usage metrics is available 48-96 hours after online publication and is updated daily on week days.
Initial download of the metrics may take a while.