| Issue |
A&A
Volume 555, July 2013
|
|
|---|---|---|
| Article Number | A57 | |
| Number of page(s) | 17 | |
| Section | Interstellar and circumstellar matter | |
| DOI | https://doi.org/10.1051/0004-6361/201321547 | |
| Published online | 01 July 2013 | |
Mass and motion of globulettes in the Rosette Nebula⋆,⋆⋆
1
Stockholm Observatory, AlbaNova University Centre, Stockholm
University, 10691
Stockholm, Sweden
e-mail:
gahm@astro.su.se
2
Chalmers University of Technology, Department of Earth and Space
Sciences, Onsala Space Observatory, 43992
Onsala,
Sweden
3
Department of Physics, PO Box 64, 00014 University of Helsinki,
Finland
4
Finnish Centre for Astronomy with ESO (FINCA), University of
Turku, Väisäläntie
20, 21500
Piikkiö,
Finland
Received:
22
March
2013
Accepted:
30
April
2013
Context. Tiny molecular clumps are abundant in many H ii regions surrounding newborn stellar clusters. In optical images these so-called globulettes appear as dark patches against the background of bright nebulosity. The majority of the globulettes were found to be of planetary mass in a previous optical investigation, while the largest objects may contain more than half a solar mass.
Aims. We aim to clarify the physical nature of globulettes by deriving densities and masses, and to determine their velocities as a function of position over the nebula. This information will provide clues to the question of origins, evolution, and fate of globulettes. The Rosette Nebula is relatively rich in globulettes, and we selected a sample of well-confined objects of different sizes for the present investigation.
Methods. Radio observations were made of molecular line emission from 16
globulettes combined with near-infrared (NIR) broad-band
JHKs and narrow-band Paschen
β and H2 imaging. Ten objects, for which we collected
information from several transitions in  and
and
 , were modelled
using a spherically symmetric model.
, were modelled
using a spherically symmetric model.
Results. Practically all globulettes were detected in our CO survey. The
observed (3–2) and (2–1)
line temperatures range from 0.6 K to 6 K, the being a third of
this. As a rule, the lines are narrow, ~1.0 km s-1. The best fit to observed
line ratios and intensities was obtained by assuming a model composed of a cool and dense
centre and warm and dense surface layer. This model provides estimates of maximum and
minimum mass; the average masses range from about 50 to 500 Jupiter masses, which is
similar to earlier estimates based on extinction measures. The selected globulettes are
dense, nH ~ 104 cm-3, with very thin
layers of fluorescent H2 emission, showing that the gas is in molecular form
just below the surface. The NIR data show that several globulettes are very opaque and
contain dense cores. No infrared-excess stars in the fields are associated with
globulettes. Internal gas motions are weak, but some larger objects show velocity-shifted
components associated with tails. However, most globulettes show no signs of tails or
pronounced bright rims in contradiction to current numerical simulations of clumps exposed
to intense stellar radiation. Because of the high density encountered already at the
surface, the rims become thin, as evidenced by our Pβ images, which also
show extended emission that most likely comes from the backside of the globulettes. We
conclude that the entire complex of shells, elephant trunks, and globulettes in the
northern part of the nebula is expanding with nearly the same velocity of ~22
km s-1, and with a very small spread in velocity among the globulettes. We
note that the velocities observed for background shells do not fit into a spherically
expanding nebular complex.
Conclusions. Some globulettes are in the process of detaching from elephant trunks and shells, while other more isolated objects must have detached long ago and are lagging behind in the general expansion of the molecular shell. Several globulettes are presently subject to heavy erosion from the intense radiation field from the central stars and eject gas streams (tails), while other quite isolated objects lack such signatures. We envision that after detachment, the objects erode to isolated and dense clumps. The suggestion that some globulettes might collapse to form planetary-mass objects or brown dwarfs is strengthened by our finding of dense cores in several objects. Such free-floating low-mass objects would move at high speed from the start and escape from the region.
Key words: HII regions / ISM: molecules / ISM: kinematics and dynamics / evolution / ISM: individual objects: Rosette Nebula
Based on observations collected at Onsala Space Observatory, Sweden, European Southern Observatory, Chile (084.C-0299(A) and 088.C-0630(A)) and Nordic Optical Telescope, La Palma, Spain, and with the Atacama Pathfinder Experiment (APEX), Llano Chajnantor, Chile (O-088.F-9318A).
Table 2 and Appendix A are available in electronic form at http://www.aanda.org
© ESO, 2013
1. Introduction
Young stellar clusters are surrounded by expanding H ii regions as a result of light and winds from central O and B stars that act on the ambient molecular cloud. Optical images of such magnificent nebulae show a mix of bright and dark nebulosity. The dark features mark remnants of the cold molecular cloud that have been compressed into shells and accelerated away from the central cluster. They contain dust, and are seen in silhouette against the bright background coming mainly from emission lines formed in the ionized bubble. Remarkable formations appear in these shells, such as elongated dusty pillars, the so-called elephant trunks that point like fingers to the central cluster.
A number of such H ii regions contain distinct, but very small clumps, as recognized early by Minkowski (1949) and Thakeray (1950). Herbig (1974) noted that many such cloudlets found in the Rosette Nebula have teardrop forms with bright rims facing the central cluster. More detailed studies followed, and several of these focused on the so-called proplyds, which are photoevaporating disks surrounding very young stars (Bally et al. 2000; Smith et al. 2003, and references therein). In these studies small cloudlets without any obvious central stellar objects were recognized as well.
Hester et al. (1996) drew the attention to some very tiny (photo-)evaporating gas globules (EGGs) in the Eagle Nebula, without any sign of embedded stars. Since then, such starless cloudlets have been searched for in more than 20 H ii regions in systematic studies in Reipurth et al. (1997; 2003), De Marco et al. (2006), Gahm et al. (2007, hereafter Paper I), and Ito et al. (2008). These studies show that the majority of these objects have radii <10 kAU with size distributions that typically peak at ~2.5 kAU. In Paper I, masses were derived from extinction measures, indicating that most objects have masses <13 MJ (Jupiter masses), which currently is taken to be the domain of planetary-mass objects. Hence, these tiny clouds form a distinct class of objects and are unrelated to the much larger globules spread in interstellar space. The objects have been given many names, but here we stick to the designation proposed in Paper I, namely globulettes, to distinguish them from globules and proplyds.
Most globulettes appear as dark, roundish patches in Hα images and show no traces of bright rims. Some objects are more elongated and even teardrop shaped. Only a small fraction of the globulettes have distinct bright rims or halos. Many objects are quite isolated and located far from molecular shells and elephant trunks in the regions. Others are seen clustering close to trunks or shells, and there are objects connected by thin filaments to the larger blocks, suggesting that globulettes may form as a consequence of erosion of these larger structures.
The fact that many globulettes are quite isolated from larger molecular blocks indicates that they can survive for quite some time in harsh environments. This is in accordance with the long survival times derived in Paper I, based on the analytic treatment of photoevaporating clumps by Mellema et al. (1998), and from more detailed 3D numerical simulations by Kuutmann (2007). In the latter study lifetimes of ~5 × 10⁴ years were obtained for ~30 MJ objects, and the expected lifetime increases with mass. In these models, the globulettes are protected against immediate photodisintegration by an ionized bubble that expands like an umbrella in the direction of the cluster, and interacts with and removes impinging UV photons.
In the numerical simulations the objects develop bright rims from the ionized gas on the side facing the clusters. Moreover, the objects take teardrop forms, and eventually very long, dusty tails extend from the backside, in the opposite direction from the cluster. The cores are also accelerated through the interaction with light from central stars, known as the “rocket effect”. In the calculations by Kuutmann (2007) a globulette can reach terminal velocities of 5 to 10 km s-1 with respect to the initial rest frame. However, one expects that the globulettes move outwards from the start with the same velocity as the system of trunks and shells.
The outer pressure from the surrounding warm plasma and the radiation pressure contribute in confining the objects, and one expects that the initial penetrating shock, generated by photoionization, leads to compression of the interior. As discussed in Paper I, some of the larger globulettes may already have, or can develop, denser cores that collapse to form brown dwarfs, or planetary-mass objects, before evaporation has proceeded very far. Such objects initially have high velocities in the direction away from the cluster and will therefore eventually shoot out to the galactic environment like interstellar bullets.
Many low mass objects in interstellar space have been confirmed to be free-floating planetary-mass objects (Quanz et al. 2010, and references therein). From a more recent survey of sources of gravitational microlensing, Sumi et al. (2011) concluded that the total number of unbound planets in the Milky Way could be very large indeed, several hundred billions, or almost twice the number of main-sequence stars. It is usually assumed that such planets once formed in circumstellar protoplanetary disks, where perturbations led to ejection (e.g. Veras et al. 2009). Since there are binaries composed of very low-mass objects (e.g. Jayawardhana et al. 2006; Gelino et al. 2011; Burgasser et al. 2012), it is clear that isolated low-mass objects also form in situ from isolated small cloudlets. In Paper I it was suggested that globulettes in H ii regions could be an alternative source of feeding the galaxy with free-floating planetary-mass objects.
There are many questions concerning the nature and fate of globulettes, and it is desirable to collect more information on their physical state. A great puzzle is that the majority show no signs of bright rims, teardrop forms, or extended dusty tails, as predicted by the models. Inclination is obviously of importance, since elongated objects may appear round if they are oriented along the line-of-sight. As a consequence, bright rims on the remote side could escape detection since they suffer from extinction in the optical spectral region. Another question is whether some globulettes have denser cores or even host stars or planets. The masses derived in Paper I were based on column densities of dust and an assumed gas-to-dust ratio of 100. Complementary molecular line observations would provide independent mass estimates based on the gas content. Finally, it is of interest to find out how the globulettes move relative to adjacent trunks and shells, and if there is evidence that they have been accelerated due to the “rocket effect”.
We have conducted radio observations of molecular line emission and near-infrared (NIR) broad and narrow-band imaging to shed more light on the properties of globulettes. We have selected objects in the Rosette Nebula surrounding the cluster NGC 2244 from the sample in Paper I, and added some cloudlets of special interest in the same area.
Globulettes and shells observed with the Onsala 20-m antenna, APEX, and NTT.
For information on previous studies of the Rosette Nebula, including NIR surveys, see the review by Róman-Zúñiga (2008). Of particular relevance to our molecular line observations is the large-scale CO survey by Dent et al. (2009) and the maps in CO and CS of cloudlets by González-Alfonso & Cernicharo (1994). Elephant trunks in the area have been mapped by Schneps et al. (1980) and Gahm et al. (2006).
2. Observations, reductions, and objects
2.1. Observations at Onsala space observatory
The observations were carried out in April to June 2010, February to March 2011, and February 2012 using a 3-mm SIS receiver at the 20-m telescope at Onsala Space Observatory (OSO). We observed 12CO J = 1–0 at 115.271 GHz, and/or 13CO J = 1–0 at 110.201 GHz. A few objects were also observed in the HCO+J = 1–0 transition at 89.189 GHz. All globulettes and observed transitions in the respective object are listed in Table 1.
The observations were performed in the frequency-switching mode, using a 1600-channel hybrid digital autocorrelation spectrometer at 25 kHz channel spacing (Δv ~ 0.07 km s-1) and a bandwidth of 40 MHz. The single-sideband system temperature was typically around 1000–1400 K for 12CO, and 400–600 K for 13CO. The pointing was checked regularly, and we estimate the pointing error to be less than a few arcseconds. At 115 GHz, the full width at half maximum (FWHM) beam size of the 20 m-antenna is 33″, and the main beam efficiency ~0.30 (for an average elevation of approximately 30°). The chopper-wheel method was used for the intensity calibration. The data reduction was performed with the spectral line software package xs1.
To ensure that the observed signals originate in the selected globulette off-set positions, normally at 30″ or 45″ from the globulette, were also observed. Some globulettes are projected on a background of more extended molecular emission, and for these, and also for a few objects with complex line profiles, additional off-set positions were included.
2.2. APEX observations
Observations of two higher 12CO and 13CO transitions were carried out in September and November 2011 with the 12 m APEX2 telescope at Llano Chajnantor, Chile: 12CO J = (2–1) at 230.538 GHz, and J = (3–2) at 345.796 GHz, and 13CO J = (2–1) at 220.399 GHz, and J = (3–2) at 330.588 GHz. We used two single sideband heterodyne SIS-receivers mounted on the Nasmyth-A focus: APEX-1 and APEX-2. All observations were performed in position-switching mode. The FWHM is 27″ at 230 GHz, and 18″ at 345 GHz, and the corresponding main beam efficiencies are 0.75 and 0.73. The RPG eXtended bandwidth Fast Fourier Transform Spectrometer (XFFTS) has 32 768 channels and consists of two units with a fixed overlap region of 1.0 GHz and an instantaneous bandwidth of 2.5 GHz. The channel spacing is thus 76.3 kHz, and the velocity spacing Δv is 0.1 and 0.07 km s-1 at 230 and 345 GHz, respectively. The pointing was checked regularly, and the error is estimated to be within 2″. The data reduction of the APEX data was performed with CLASS, part of the GILDAS-package3, and also checked with xs.
Globulettes of different sizes were selected from the sample observed at OSO (see Table 1), and a few off-set positions were included in the APEX observations as well to confirm the OSO results.
2.3. NIR observations
Four fields containing radio-detected globulettes in the Rosette Nebula were imaged with
the Son of Isaac (SOFI) infrared spectrograph and imaging camera on the New Technology
Telescope (NTT) at the European Southern Observatory in Chile using the J
, H , and Ks broad-band filters, and the narrow filters
NB H2 S1, which covers the H2 1-0 S(1) 2.12 μm spectral line,
and NB 2.090, which covers the adjacent continuum. The observations were conducted during
four nights in December 2009 through January 2010. The SOFI field of view is 49, and its
pixel size 0 288. The
JHKs observations were carried out in
the on-off mode instead of in the standard jitter mode to retain the possible extended
surface brightness features. After each on-integration an off-position outside the Rosette
Nebula was observed, and jittering was performed after two on-off pairs. One-minute
integration time, which consisted of six individual 10-s integrations, was used in
JHKs. The observed on-source times
per filter were 26 min, except for one field (Field 19), which was observed for 13 min.
288. The
JHKs observations were carried out in
the on-off mode instead of in the standard jitter mode to retain the possible extended
surface brightness features. After each on-integration an off-position outside the Rosette
Nebula was observed, and jittering was performed after two on-off pairs. One-minute
integration time, which consisted of six individual 10-s integrations, was used in
JHKs. The observed on-source times
per filter were 26 min, except for one field (Field 19), which was observed for 13 min.
The H2 observations were obtained in the jitter mode, where the surface
brightness with a scale larger than the jitter box (30′′) is smeared and/or
cancelled in the data reduction. Only small-size features and gradients in the original
surface brightness structure were retained. Point-like sources and galaxies were
unaffected by the jittering. The fields have 40 frames of one-minute integrations obtained
using three 20- or two 30-s integrations. The average seeing during the observations was
~08. Because the
NB 2.090 is narrower than the NB H2 S1 filter, a 20% longer total integration was required
in this filter. In addition to the broad-band on-off observations, one SOFI field (Field
19) was observed in the jitter mode in
JsHKs. Complementary SOFI imaging of
several fields was performed in January 2012 through a narrow-band Paschen
β filter (at 1.28 μm) combined with a narrow-band
continuum filter.
The IRAF4 external XDIMSUM package was used in the data reduction. The images were searched for cosmic rays, were sky-subtracted, flat-fielded, illumination-corrected, registered and averaged. For the JHKs observations the four off-position images nearest in time to each on-position image were used in the sky-subtraction. For the jittered images the two neighbouring images were used. An object mask was constructed for each off image. Applying these masks in the sky-subtraction produced hole-masks for each sky-subtracted image. Special dome flats and illumination-correction frames provided by the NTT team were used to flat-field and to illumination-correct the sky-subtracted images. Rejection masks combined from a bad-pixel mask and individual cosmic-ray and hole masks were used when averaging the registered images.
The Source Extractor software v.2.5.0 (Bertin & Arnouts 1996) was used to extract the photometry for each reduced SOFI field.
The steps to build the stellar photometry catalogues out of the SOFI magnitudes are the
same as in Mäkelä & Haikala (2013). Objects
within 30 pixels from the frame edges and objects with a Source Extractor star index less
than 0.9 in more than one band were discarded. After combining the catalogues for each
field, 1375 objects remain. The limiting magnitudes for a formal error of
0 15 are
J ≈ 21, H ≈ 20, Ks ≈ 19.5 except for
Field 19, where they are 05 brighter.
15 are
J ≈ 21, H ≈ 20, Ks ≈ 19.5 except for
Field 19, where they are 05 brighter.
2.4. Selected objects
The globulettes investigated in Paper I were identified from deep narrow-band Hα images collected with the 2.6 m Nordic Optical Telescope (NOT) on La Palma, Canary Islands, Spain. In the Rosette Nebula a total of 145 globulettes were listed. We have observed 16 of these at OSO and 10 with APEX. The objects were selected as to cover such broad a range in mass as possible, but objects with masses in the planetary domain could not be reached. Moreover, the selected objects are relatively dense in comparison with some more diffuse globulettes listed in Paper I.
 |
Fig. 1 Cuts from Hα images presented in Paper I of different fields in the Rosette Nebula, including globulettes and positions in shells that were selected for the subsequent analysis, as numbered in Table 1. The fields all span 4.4′ × 3.4′, and are numbered as in Paper I. The bottom second panel is a blown-up Hα image of the dense globulette RN 88, diameter ~ 6 ″ in Field 15. The string of globulettes in Field 15 is connected to a long filamentary shell containing a claw-like feature. The upper part of the prominent elephant trunk “the Wrench” is seen southwest of “the Claw”. North is up and east is to the left. |
Another four globulettes located in areas outside the optical survey were observed at OSO; one of them was included in the APEX observations. In addition, four positions in molecular shells in regions adjacent to globulettes were observed at OSO. The NIR images contain several globulettes and trunks, and the results of this survey will be discussed in more detail in a follow-up paper. Ten of the radio-detected globulettes fall in the NIR fields – these data are considered in the present article as well.
The observed objects are listed in Table 1 and are identified according to their catalogue number in Table 2 of Paper I. Here RN denotes the Rosette Nebula. Central positions of our radio observations were also taken from Paper I. Then follow the objects added to this list, globulettes (marked A, B, etc.) for which central positions were selected from existing sky views of the Rosette Nebula, and shells (marked Shell A, B, etc.) with positions measured from NOT images. The object designated Claw E forms the eastern part of a yaw-like structure, composed of twisted and very thin filaments. The western part of the Claw was included in the CO survey by Gahm et al. (2006) of the adjacent “Wrench Trunk”, which also has an yaw-like end (Carlqvist et al. 2003).
Columns 2 and 3 in Table 1 list sources observed for 12CO and 13CO J = 1–0 at OSO. Objects mapped over a small area around the central position in selected lines are marked. The APEX observations marked in Col. 4 include all four observed lines. In Col. 5 objects that are included in the NIR fields are marked. In the the last column, objects also observed in HCO+(1 – 0) are marked. RN 40 is identical to TDR 10 as designated in González-Alfonso & Cernicharo (1994), and RN A is identical in position to the highly obscured X-ray source ACIS #86 listed by Wang et al. (2010). Among the CO-detected clumps and distinct objects in Dent et al. (2009), no 8, here referred to as D 8, is close in position to this X-ray source. From the same list, D 10 is identical to RN 5, and D 6 includes objects RN 35 and 38, not resolved in Dent et al. (2009). D 15 is identical to RN D (off-set by ~7″).
Figure 1 shows Hα images that were extracted from the fields in the NOT survey and include a number of globulettes listed in Paper I. The locations of the fields in the Rosette Nebula can be found in Fig. 1 of Paper I from the Field number. Objects observed in the present investigation are marked according to the designations in Table 1. Also shown is an enlargement of RN 88 in Field 15 as an example of a well-confined and dense isolated globulette. RN 88 appears to be completely dark in this high contrast image, but weak residual Hα emission covers the object. In Field 8, RN 39 is marked because it is included in the CO map of TDR 10 in González-Alfonso & Cernicharo (1994), where RN 40, separated by 24.5″, is the stronger source. However, RN 39 is outside our telescope beams.
Some globulettes are connected by very thin filaments to shell structures, as in Field 18, and others are quite isolated from trunks and shells, as in Field 19. Both round and elongated globulettes are represented. In Field 15 a remarkable string of globulettes extends to the east of the Claw.
The object RN A, centred at an X-ray source, is not a regular globulette. It is attached to the shell and has the form of a block with finger-like extensions. Our radio and NIR observations reveal that this region is highly complex and contains an outflow; this object will be analysed in more detail in a separate paper. RN A is therefore not included in the subsequent analysis of globulettes in the Rosette Nebula and is not displayed in Fig. 1. RN B and C are two distinct globulettes located in areas outside the NOT survey north of the inner molecular shell. RN D is seen projected on the central cavity not far from the central cluster. The locations of all these objects can be found in Fig. 2, where some NOT-included objects shown in Fig. 1 are marked. The Wrench is in the middle of the image with the yaw-like feature the Claw. The position of Shell A falls inside the RN A circle. The four NIR fields are also marked. Their central positions are 06:31:00.9 +05:07:03.6, 06:31:17.9 +05:08:05.0, 06:31:39.8 +05:11:16.1, and 06:32:20.8 +05:14:06.0, and cover areas in fields 7, 8, 15, and 19.
 |
Fig. 2 Overview of part of the Rosette Nebula composed from images in Hα (red) and O iii (green). Objects not included in the NOT survey are marked, as are some NOT objects for orientation. The NIR fields are depicted as white boxes, covering from right to left Fields 7, 8, 15, and 19. The elephant trunk the Wrench is in the middle of the image with the Claw at its upper end (image: Canada-France-Hawaii Telescope). |
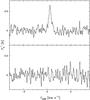 |
Fig. 3 13CO(1–0) emission towards RN 40 over the LSR velocity range –8 to +9 km s-1. The top panel shows a 10-sigma detection at the on-position, and the lower panel shows the non-detection at the off-position (30″, − 30″) with an rms of 45 mK. |
3. Results
3.1. Spectral line parameters
Molecular line emission was detected from all objects, with the exception of the small
globulettes RN 12 and C. All our APEX and Onsala spectra at on-source-positions of objects
detected in a least one transition are shown in the on-line Figs. A.1 and A.2. We are confident
that we can distinguish the targets from other sources, since no signal is detected at
off-positions. An example is shown in Fig. 3 with
13CO(1–0) spectra obtained for RN 40 at on- and off-position (0″, –30″). The
intensity scale in all spectra is expressed in terms of the antenna temperature reduced to
outside the atmosphere,  . Most objects
show distinct and narrow lines, ~1.0 km s-1. The line peak velocities agree
well for lines from various transitions with some exceptions. For several objects,
emission from shells in the background enters, but with velocities different from the
globulettes. At off-set positions, the globulette signal is gone while the background
emission remains.
. Most objects
show distinct and narrow lines, ~1.0 km s-1. The line peak velocities agree
well for lines from various transitions with some exceptions. For several objects,
emission from shells in the background enters, but with velocities different from the
globulettes. At off-set positions, the globulette signal is gone while the background
emission remains.
 |
Fig. 4 Examples of spectra obtained with APEX (upper panels) and at OSO (lower panels) for globulettes of different size. From left to right: RN 9 (small), 114 (medium), and 129 (large). Upper panels: the 12CO(3–2), 13CO(3–2), 12CO(2–1), and 13CO(2–1) lines are plotted in black, green, red, and blue, respectively. Lines from (2–1) transitions are drawn as curves, and from (3–2) transitions as histograms. Lower panels: 12CO(1–0) profiles (thick); 13CO(1–0) profiles (green, thin). The 13CO(1–0) lines are multiplied by ten (RN 9) or three (RN 114 and 129). RN 9 is identified with the narrow component at ~0 km s-1, while the broader component at ~+2 km s-1 comes from more extended gas. In RN 129 a “blue” wing is present in several lines. |
In Table 2 (also available from CDS) we present line parameters derived for all objects and transitions. Objects with broad lines are so marked. The globulettes are normally well confined in the Hα images presented in Paper I, and size in Col. 2 refers to the area measured by us from the optical images, not including faint obscuring tails and plumes. The optically derived mass from Paper I expressed in Jupiter masses is listed in Col. 3. In Col. 9 velocities of the most prominent background components are given, to be discussed in Sect. 4.6. These components are as a rule strong and broad and at velocities very different from the globulettes. Column 10 gives the 13CO(1–0) velocity if observed, otherwise it is obtained from a 12CO line. In Col. 11 objects with complex profiles (com.) that may contain more than one component are noted (futher discussed in Sect. 4). Objects observed for HCO+ are indicated with integrated intensity in parenthesis.
For the subsequent discussion we divided the globulettes into three size groups depending on area according to Table 2: small (<80 arcsec2), medium (80–200 arcsec2), and large (>200 arcsec2). It should be kept in mind, though, that all selected globulettes are among the largest listed in Paper I. Examples of spectra obtained at several frequencies of globulettes of different size are shown in Fig. 4. RN 9 (left panels) is seen in projection against local extended emission responsible for the broader component at ~+2 km s-1. At on-position also the narrow component at ~0 km s-1 enters the spectra and is identified with the globulette. Some profiles obtained for RN 129 are asymmetric (right panels). Objects with pronounced line asymmetries are discussed in Sect. 4.5.
A general feature is that the peak
intensity of the strongest component is the same, or nearly the same, in the
12CO(3–2; 2–1) and the 13CO(3–2; 2–1) transitions irrespective of
globulette size. This is surprising considering that the beam-filling in the
12CO(3–2) transition is higher by a factor 2.25 than (2–1). The only notable
exception to this is RN 40, with a 12CO(3–2) intensity of only 60% of that in
13CO(2–1). The and
13CO(1–0) lines are usually very weak compared with lines from the higher
levels. When wing emission or a second velocity component is detected, the observed
line ratios
varies over the line (Fig. A.1).
In the area containing the tiny globulettes RN 88, 91, 93, 94, and 95 two velocity components are detected. For these globulettes there is some confusion regarding which signal comes from the globulettes, and some lines are broad and shallow. Our identifications are based on the appearance of one off-set spectrum from 12CO(1–0), which is common to all objects. This region is discussed in Sect. 4.4.
3.2. SOFI results
 |
Fig. 5 Jittered Js, H, and Ks images of an area in Field 19. The cores of RN 114, 122 and 129 are opaque in the Js filter. |
 |
Fig. 6 Upper panels: continuum, H2 and the H2 – continuum difference images of an area in Field 15 where the Claw and the string of small-size globulettes are visible in the two latter images. Lower panels: difference images of areas in Fields 7, 8, and 15. The locations of some globulettes and one shell position are marked for orientation. |
 |
Fig. 7 Left and middle panels: 1.26 μm continuum and Pβ images of an area in Field 15. The Claw at the centre is dark in the Pβ image, and so are some of the tiny globulettes to the east of the Claw. Right panel: the opaque cores of RN 114, 122, and 129 are distinct on this Pβ image of an area in Field 19 (see also Fig. 5). |
The jittered Js, H and Ks images of Field 19 are shown in Fig. 5. Most of the globulettes, including the very small ones, are visible. In the Ks images they appear as well-defined, faintly luminous bright-rimmed objects with sizes that match those seen in the NOT Hα images. In the Js image a few globulettes are seen as dark silhouettes, and several have bright rims as in the Ks images. The dark cores seen in the Js images of RN 122 and 129 (left panel), for instance, are about half the size of those measured in Hα and flag the presence of internal cores of higher density than traced in the optical survey. The jittering observing mode smooths out any extended surface brightness and furthermore, the data reduction forces the average background level to zero. Jittering may also smooth out to some extent the size and depth of areas of substantial extinction observed especially in the direction of the larger globulettes and shells and trunks. Therefore we cannot derive NIR extinctions and infer column densities of dust, as was done in the optical spectral region (Paper 1). Some globulettes are also seen in the H image, but they are less prominent than in the Js or Ks images.
The Ks filter contains several molecular hydrogen lines and the hydrogen Brackett γ line at 2.17 μm. The observed fields were therefore observed also with the narrow-band filters NB H2 S1 covering the H2 1-0 S(1) line at 2.12 μm, and NB 2.090, which covers the adjacent continuum. The difference between the two images contains only H2 emission, and all other features, including stars should vanish. The continuum, the H2, and the difference images of Field 15 are shown in the upper panels of Fig. 6. The Claw and the string of small-size globulettes is seen in the H2 image, but not in the neighbouring continuum image. The difference image demonstrates that the globulette rims emit brightly in the 2.12 μm line. Faint H2 surface emission inside the globulettes is seen as well. NTT is an alt-azimutal telescope, and therefore the stellar diffraction spikes rotate on the images depending on the time of observation, and residuals resulting from the incomplete subtraction can be seen in the difference images.
The lower panels in Fig. 6 shows continuum-subtracted H2 1–0 S(1) images in three areas located in Fields 7, 8, and 19. The incomplete elimination of stars in Field 8 was caused by the seeing, which varied between the continuum and H2 observations. The globulettes in these images have extremely thin bright rims, which are not resolved in the SOFI images. Bright rims also border trunks and other shell structures observed. A comparison of the H2 and the Ks images shows that the H2 2.12 μm line emission can explain approximately one third of the surface brightness observed in the Ks image. Most probably, the major part of the excess emission is due to line emission in other H2 lines and the Brackett γ line in the Ks filter. Results from the H2 imaging will be discussed in detail more in a separate paper.
Bright rims, though fainter than in the Ks images, are seen in the J and H images. These two filters also contain some rotational H2 lines and the hydrogen Paschen β line at 1.28 μm enters the J band. The 1.26 μm and Pβ narrow-band filter images of the area selected in Field 15 are shown in Fig. 7 (left and middle panels). In the Pβ image the Claw and the string of tiny globulettes are seen dark against the bright background, whereas in the continuum image the objects cannot be detected. This is also the case for some objects in Field 19 (right panel).
3.3. SOFI stellar photometry
The stars in the SOFI field, which covers parts of the NOT Fields 7 and 8 (Fig. 1), were divided into two to investigate the reddening in
the direction of the general background and in the direction of globulettes and shell
structures. The
(J − H)/(H − Ks)
colour–colour diagrams of stars in these directions are shown in Fig. 8. The panel to the right includes stars in the direction of globulettes
or shells, and the one to the left stars in surrounding areas. The arrows in the diagrams
indicate the effect of five magnitudes of visual extinction. The left panel shows a
grouping around the unreddened main-sequence, probably of unreddened or only slightly
reddened late-type stars. The stars below the unreddened late main-sequence are possibly
medium-mass stars. The uppermost grouping of stars in the left panel are stars in or
behind the nebula. The location of these stars indicates a reddening of
15 to
20 of visual
extinction.
The number of substantially reddened stars is larger in the right panel. The grouping of stars around the unreddened main sequence is missing and only few stars fall below. The diamonds identify stars detected in the direction of globulettes in this field. Since these stars show no evidence of infrared excess emission, we conclude that they are reddened stars behind the globulettes, and not embedded very young objects. From our data we cannot conclude whether the background stars are dwarfs or giants, but assuming a normal interstellar reddening law, the total extinction towards these globulettes is in the range 3 < AV < 10 magnitudes.
 |
Fig. 8 (J − H)/(H − Ks) colour–colour diagrams of stars from Fields 7 and 8. Stars outside the obscured region are plotted in the left panel, and those in the direction of shells and globulettes in the right panel. The stars detected inside globulettes are plotted as diamonds. Also plotted are the loci of unreddened giant (red, thick) and main-sequence (black, thin) stars. The direction of interstellar extinction follows the slashed lines and the vector shows a corresponding visual extinction of 5 mag. |
4. Discussion
Using the information derived in Sect. 3, we now proceed with a discussion of the physical properties of the globulettes and how their velocities are distributed across the nebula. Because most of the globulettes are smaller than the HPBW of APEX at all observed frequencies, all spectral line modelling must rely on the physical sizes derived from optical and NIR images. The various images tracing both continuum and line emission allow us to draw some conclusions on density and density structure. Similarly to Paper I, we adopt a distance of 1.40 kpc to the complex and a central velocity of +17 km s-1 (LSR) for the cluster and surrounding ionized gas in deriving physical quantities and estimates of mass.
The globulette leading edges, i.e. the sides facing the central cluster, are sharp both in the optical and NIR. Some of the larger globulettes have shining bright edges in the Hα line. However, if the background is bright, such rims may not be intense enough to be noticed. The southern edge of the Wrench and the edges of RN 73, 78–80, and 84 in Field 14 (see Paper I) are bright, but those of the globulettes in Field 15 (RN 88, 94 and 95) and Field 19 are not (see Fig. 1).
Globulettes with bright Hα rims also have bright rims in the J and Ks filters. The lack of bright rims in the narrow-band continuum images at 1.26 μm (Fig. 7) and 2.09 μm (Fig. 6) shows that the bright rims in the Js and Ks filters (Fig. 5) are not due to scattering but to line emission, as confirmed by the H2 and Pβ images (Figs. 6 and 7). The background in the Pβ image is high but the Claw shows a distinct limb brightening. The globulettes just east of the Claw are detected in the image, but only in absorption against the background. Either bright rims do not exist, or they are very thin or faint and escape detection.
The bright rims observed in Hα show that the density just above the globulette surface must be lower than that in the globulettes. Otherwise the optical depth at wavelengths below 1102 Å, where the H2 absorption takes place, would be high and the radiation would not penetrate deep enough to reach the surface. Interstellar extinction at 1.282 μm (Pβ line) is significantly lower than at 6557 Å (Hα). Furthermore, the H2 rims coincide with the Hα and Pβ rims, which shows that matter turns into molecular form close below the surface. As stated in Paper I, from the analysis in Grenman (2006) the distribution of material in globulettes is not Gaussian, and the density is high even close to the globulette surface and is very low outside. Another sign of high density is that especially the larger objects are seen as dark silhouettes against the Pβ background, which also applies to some of the smaller globulettes, such as RN 88, 91, 93, 94, and 95. We conclude that the globulettes are relatively dense and sharply bound objects consisting of molecular gas floating in a plasma of low density.
4.1. H2 column density and mass
Hydrogen is predominantly found in molecular form in the globulettes, therefore visual extinction scales directly with H2 gas column density, which can be estimated from the extinction to background stars in directions of globulettes. The NICER method presented in Lombardi & Alves (2001) and the SOFI NIR photometry can be used to estimate the large-scale visual extinction within areas imaged in JHKs. In Sect. 3.3 we found that the extinction in areas outside globulettes, elephant trunks, and shell features is low, generally lower than 2 mag. The extinction towards individual globulettes must be estimated individually, however.
A highly reddened star is seen in the direction of globulette RN 35 (Fig. 8). Since the spectral type is unknown, one can only
estimate upper and lower limits of the extinction. A star at the uppermost tip of the
giant branch in Fig. 8 would have a total visual
extinction of ~75. The
corresponding value for a star at the late unreddened main sequence or mid-giant branch is
100.
The interstellar extinction to the Rosette complex is
AV ≈ 1.4 (Ogura & Ishida 1981; Celnik 1986). Allowing for 25 of foreground
and also background extinction, the lower and upper estimates for RN 35 are 5 and 7 mag,
respectively. If the star is even earlier in spectral type, the upper limit could be
higher. Using the ratio of visual extinction to hydrogen column density given by Bohlin et
al. (1978), the extinction of
50 translates
into an H2 column density of 4.7 × 1021 cm-2. RN 35 is
very symmetric in shape, and with a diameter of 18.6 kAU (Paper I) this column density
corresponds to an average density of 1.7 × 104 cm-3. With a mean
molecular mass per H2 molecule of 2.8 amu, the total mass can be estimated to
be 0.44 M⊙. This mass is about 2.5 times larger than the
optically derived mass in Paper I, and if the extinction amounts to
75, the
difference is even larger. The extinction derived for the star behind RN 35 probes only
one direction through the cloud, however, and therefore the masses derived from the
optical and NIR images are not directly comparable.
4.2. Molecular line observations
The interpretation of the molecular line data is not straightforward because we have no a priori knowledge of the small-scale globulette density, temperature, and velocity structure. The size of most of the observed globulettes is smaller than the APEX HPBW at 345 GHz and no mapping is possible. However, the high signal-to-noise ratio and good velocity resolution in the APEX spectra gives an opportunity to draw conclusions about the physical structure of globulettes.
The solution of the radiative transport equation, neglecting background radiation and
with a constant source function, is  (1)where
ηmb is the main beam efficiency,
ηbf the beam-filling factor (see Eq. (3) and (4)) and
J(Tex) the radiation temperature
(1)where
ηmb is the main beam efficiency,
ηbf the beam-filling factor (see Eq. (3) and (4)) and
J(Tex) the radiation temperature
 (2)where the
approximation is valid if hν ≪
kTex.
(2)where the
approximation is valid if hν ≪
kTex.
A critical value in Eq. (1) is the beam-filling factor. The optical and NIR shape of the globulettes ranges from a nearly perfect, opaque circle (RN 88, Fig. 1) to cometary-like objects with a compact head and elongated, more diffuse tail (e.g. globulettes in Field 19, Fig. 1). Besides the shape, the size also varies strongly. The cores of interstellar dark clouds and normal globules are usually surrounded by less dense, extended envelopes, but as described above, the globulettes are more compact. The beam-filling of the compact round globulettes can thus be best estimated assuming a disk with a size corresponding to the projected optical size of the globulette.
The beam-filling factor of a disk of diameter θD, a constant
brightness temperature distribution over the disk and observed with a Gaussian beam with a
half-width at half-maximum of θmb is  (3)The beam-filling
factors of symmetric, round globulettes can be estimated using the disk beam-filling
factor. For elongated globulettes this is a combination of the disk filling factor (the
leading edge) and the filling factor for a Gaussian distribution (the tail). The
beam-filling factor, ηbf, assuming that both the source
brightness distribution and the antenna response are circularly symmetric and Gaussian
with a half width of θs, is
(3)The beam-filling
factors of symmetric, round globulettes can be estimated using the disk beam-filling
factor. For elongated globulettes this is a combination of the disk filling factor (the
leading edge) and the filling factor for a Gaussian distribution (the tail). The
beam-filling factor, ηbf, assuming that both the source
brightness distribution and the antenna response are circularly symmetric and Gaussian
with a half width of θs, is  (4)The Onsala and APEX
beams at the frequencies (115,
230 and 345 GHz) are 33′′, 27′′ and 18′′, respectively.
For a large-size source, filling the 345 GHz HPBW, ηbf is
0.19, 0.27 and 0.5 for a disk, and 0.23, 0.31 and 0.5 for a Gaussian distribution (Eq. (3)
and (4)). For a small-size source like RN 88 (diameter 6′′) the corresponding
values are 0.023, 0.034 and 0.075 for a disk, and 0.032, 0.047 and 0.1 for a Gaussian
distribution. For globulettes with diameters of 10′′ or less the disk
beam-filling factor is 25% smaller than for the CO(3–2) transition, and more than 30%
smaller for the (2–1) transition.
(4)The Onsala and APEX
beams at the frequencies (115,
230 and 345 GHz) are 33′′, 27′′ and 18′′, respectively.
For a large-size source, filling the 345 GHz HPBW, ηbf is
0.19, 0.27 and 0.5 for a disk, and 0.23, 0.31 and 0.5 for a Gaussian distribution (Eq. (3)
and (4)). For a small-size source like RN 88 (diameter 6′′) the corresponding
values are 0.023, 0.034 and 0.075 for a disk, and 0.032, 0.047 and 0.1 for a Gaussian
distribution. For globulettes with diameters of 10′′ or less the disk
beam-filling factor is 25% smaller than for the CO(3–2) transition, and more than 30%
smaller for the (2–1) transition.
The APEX main beam efficiency at 230 GHz and 345 GHz is nearly the same (0.75 and 0.73).
Therefore, for a small size source with optically thick lines at the two frequencies the
observed  would depend
strongly on the source-filling factor. Not surprisingly, the CO signal towards small
globulettes is much weaker than towards the larger ones.
would depend
strongly on the source-filling factor. Not surprisingly, the CO signal towards small
globulettes is much weaker than towards the larger ones.
The 12CO(3–2)/13CO(3–2) and
12CO(2–1)/13CO(2–1) line ratios are approximately 1/3, irrespective
of the source size. This indicates that both the 12CO(3–2) and (2–1)
transitions are optically thick. The observed 12CO(3–2)/12CO(2–1)
and 13CO(3–2)/13CO(2–1) ratios do not depend on the source size but
are close to one with the exception of RN 40, for which the
ratio is 0.6.
The beam-filling factors described above assume that the source brightness temperature
has a Gaussian distribution or that the brightness temperature distribution is constant
over the visible disk and that both the and
transitions probe
the same volume of gas. However, it is unlikely that either assumption is valid and other
factors have to be accounted for. In addition to the density, the CO line temperature
depends on the excitation temperature. Assuming that the surface facing the central
cluster is heated by radiation, a major part of the 12CO(3–2) emission could
come from this warmer layer, while the (2–1) emission originates mainly from the cooler
interior. The two transitions would then trace different volumes of gas, and the
beam-filling factors would be different. Such a case was indeed observed by White et al.
(1997) in a cometary globule in the southern part
of the Rosette Nebula. This type of source structure cannot be analysed using the LTE
approximation, and a radiation transfer program is needed.
4.3. Globulette modelling
We have used a radiation transfer program developed by Juvela (1997). The program uses the Monte Carlo method and allows sources with arbitrary density, temperature, velocity, density structure and a value for general turbulence to be constructed. Virtual observations of this model can be made in desired molecules/transitions. A different beam size can be chosen for each transition. The program calculates the appropriate beam-filling factor for the source structure and the beam in each transition, and thus the program output corresponds to the observed spectrum corrected for atmospheric attenuation and divided by the appropriate main beam efficiency.
Test runs were made assuming a standard dense core structure with a cooler dense core
region and a warmer, less dense envelope, where the density decreases towards the edges.
The modelled (3–2)/(2–1) line
ratios were always much higher than the observed ones. The radiation transfer program
calculates the correct beam filling factor for each line, so the bad fit is not due to the
better beam filling of the 12CO(3–2) line. Increasing the density and
temperature of the envelope did not improve the situation. However, a better match to
observed line intensities was obtained when a hot and thin dense surface layer was added
to the latter models. Different versions of this toy model were tested.
Because only unresolved single-dish globulette spectra are available most of the input parameters must be guessed at. The observed spectra are narrow, less than 1 km s-1, which strongly restricts the value for the turbulence and the internal systematic (infall) velocity field. A turbulence of 0.2 km s-1 and an infall velocity of 0.1 km s-1 were chosen as an initial guess. Higher turbulence would produce too broad lines and higher in-fall velocity would, in addition to broadening the line, also produce spectra with a strong dip at the systemic velocity. For the smaller globulettes the values for the turbulence and in-fall had to be scaled down to obtain model spectra as narrow as observed. The density/temperature values were varied to obtain spectra similar to the observed temperatures.
To obtain the high densities needed to explain the observed NIR colours of background
stars and to model the lines, the
emission must be
optically thick. The modelled spectra are
always strongly self-absorbed, so only lower limits for Tex
can be calculated from the observed . Taking into
account the APEX beam-efficiency and the beam-filling factor as well as the observed
12CO(2–1) antenna temperature of 0.6 K for RN 88, the lower limit for this
globulette would be well in excess of 15 K. For larger globulettes, such as RN 114, the
lower limit would be 20 K. However, considering the likely self-absorption, the true
Tex must be higher. This agrees with the assumption that the
globulette surface is heated by UV radiation from the central cluster. It is clear that a
range of excitation temperatures must exist within each globulette.
Even though it was possible to construct models that produced line intensities and line
ratios similar to the observed and
intensities and
ratios, it was not possible to do this for both isotopologues simultaneously. A model that
provides the correct intensities
results in much too low intensities, and
a model providing the correct intensities fails
to explain the intensities. Two
models were constructed for each globulette observed with APEX, one giving the
line intensities
and line ratios and another for the . The
H2 densities required to model the observed
spectra are
significantly higher than those required for . The modelled
spectra are
strongly self-absorbed, which depends strongly on the source density and temperature
structure and the velocity field (turbulence and systematic motions).
We therefore used these models to provide a plausible lower (the
model) and upper
(the model) limit for
the mass of each observed globulette. The adopted values for the velocity dispersion and
systematic infall are probably adequate. The line width and shape of the spectra depend
very strongly on these two parameters, and the pool of possible values is very restricted.
No model that would produce the exact, observed or
line intensities
could be constructed, and the 12CO(3−2) line was always 10 to 15% stronger than
the (2–1) transition as were also the corresponding values for the
transitions. For
the this may be
explained by strong self-absorption. The upper and lower mass limits calculated from the
models should therefore be considered to be only crude estimates.
As expected from the beam-filling argument alone, the larger the globulette, the stronger
the observed molecular lines. The line width also increases with size. The
and
line widths
increase from 0.9 km s-1 and 0.6 km s-1 to 1.3
km s-1 and 0.9 km s-1, respectively. The morphology changes as
well: the small-size globulettes are round and become more elongated with increasing size,
i.e. tails emerge. The leading edge remains sharp, but the tail has a more diffuse
appearance. If one assumes that the tail is formed by gas and dust flowing away from the
head, then the outflowing gas should be blue-shifted with respect to the head because of
the assumed orientation of the objects. This is indeed observed, and the more asymmetric
the shape, the more pronounced the blue-shifted wing (see Sect. 4.5).
Small-size globulettes. The physical diameters of RN 9,
88, and 95 range from 8.5 kAU (RN 88) to 14 kAU (RN 9) (Paper 1, Table 2). The maximum
H2 number densities used in the models are around
1.1 × 104 cm-3 at the centre and 2.5 × 10³
cm-3 at the compressed edge. All these globulettes are seen in absorption in
the Pβ image, which also supports the modelled high central density.
Despite this high density the masses for the three objects are low. The mass lower limits
from models are 10 to
40 MJ and upper limits from
models 40 to 70
MJ. The average optical masses (Table 2) range from 20 (RN 88) and 72 MJ (RN 9).
Hence, the masses derived from visual extinction and radio line data are very similar. RN
95 has a blue-shifted velocity component, but this might be because the nearby globulette
RN 94 also enters the Gaussian beams. Another two small globulettes, RN 93 and RN 122,
were detected with APEX. The line profiles of RN 93 are very broad, however, and RN 122 is
very elongated with a blue-shifted component probably related to its distinctive tail.
Neither of these objects can be modelled with the present method. Their line intensities
are similar to what is observed towards the modelled small-size globulettes, and
presumably their masses fall in the same range.
Medium size globulettes. RN 38, 40, and 114 have diameters of 16, 17 and 22 kAU, respectively, and differ from the smaller globulettes in that they have distinctive tails in the Hα images (Fig. 1). Only the interior cores, which are round, are opaque in the Pβ images. The mass lower and upper limits derived using the spherically symmetric model are 70 and 130 MJ for RN 38 and 100 and 345 MJ for RN 114. Hence, the average masses for these objects also agree well with the values derived from optical data, namely 97 and 195 MJ.
Modelling RN 40 is problematic because the 12CO(3–2) line intensity is only 60% of the 12CO(2–1) intensity. The beam-filling factor of the 345 GHz beam for a Gaussian intensity distribution is 0.31, twice that for 230 GHz. It is impossible to construct a spherically symmetric model producing such a 12CO(3–2)/(2–1) ratio. In addition, blue-shifted wings are present (see Sect. 4.5).
RN 40 forms the head of TDR 10 observed in and
13CO(2–1; 1–0) and CS(3–2; 2–1) by González-Alfonso & Cernicharo (1994). TDR 10 also covers RN 39 situated
25′′ NW of RN 40. Curiously, their 12CO(2–1) line integral maximum
is not observed in the head of RN 40, but in the tail just to the north. In the channel
map (Fig. 3 in their paper) 12CO(2–1) is stronger at velocities
<0.5 km s-1, i.e. on the blue-shifted side,
compared with our 13CO(3–2), (2–1) and (1–0) central velocities. The
12CO(2–1) maximum would lie at the edge of the APEX 18′′ HPBW at
245 GHz, but still in the 27′′ APEX 230 GHz and the 33′′ Onsala 115
GHz beams. If the location of the 12CO(2–1) maximum in the tail were caused by
a pointing error, correcting for such a shift would move the secondary maximum, now
coinciding with RN 39, to the south of it. Thus this pointing error is not likely.
The APEX observations were pointed at the RN 40 dense core, as evidenced by the
(3–2)/(2–1)
ratio. Furthermore, the velocities of all the observed
transitions
agree. The larger beams at 230 GHz, and especially at 115 GHz trace the
emission maximum
better than the 345 GHz beam. This brings us to the question: why the
maximum is seen
in the RN 40 tail, which, at least in the optical Hα image, appears
diffuse and not opaque? One explanation could be that the
emission traces
warm but diffuse subthermally exited gas.
Large-size globulettes. Two large size-globulettes, RN 5 and 129 were
observed with APEX. Both objects are elongated, more so than the APEX HPBW at 345 GHz, and
have excess blue-shifted emission.
Curiously, in RN 5 the central line velocities of the 12CO(3–2) and (2–1) main
line components are red-shifted compared with the lines. Similarly
to RN 40, the 12CO(1–0) line is broad and red-shifted compared with the higher
transitions. It is possible to obtain a tentative mass estimate for the heads of the
globulettes covered by the single-point observation, but not for the entire globulettes.
No Pβ image is available for RN 5, but in the Hα image
(Fig. 1) the head of the globulette, which possibly
contains two fragments, is most opaque. In the RN 129 Pβ image (Fig.
7) the beam covers the most obscured part of the
globulette. The upper and lower limits for the estimated masses are 368 and 788
MJ for RN 5, and 305 and 536 MJ
for RN 129. The H2 densities are similar to those needed to model the
medium-sized globulettes above, but the masses are larger because of the size. Better
beam-filling is the main reason for the higher observed antenna temperatures. The model
cannot reproduce the strong blue-shifted emission, but it it assumed that this is due to
blue-shifted gas in the more diffuse tail (Sect. 4.5). The corresponding optical masses of 665 and 691
MJ best match the maximum mass derived above, and were
derived from slightly larger areas than covered by the APEX beams.
 |
Fig. 9 12CO(1–0) profile of the eastern part of the Claw, which is asymmetric, but is as a whole red-shifted relative to the western part of the Claw. A two-component Gaussian fit to the profile is also shown (details in the text). |
4.4. Global velocity pattern
The globulettes are distributed over a large area in the Rosette Nebula, spanning 1/2° (a projected distance of 13 pc) from RN 5 to RN 63. Most objects fall along the inner remnant shell, extending from west to northeast from the central cluster. As can be seen from Fig. 2, this shell forms part of a ring outside the northern part of the central cavity. The entire complex is blue-shifted relative to the centre of the Rosette complex by ~17 km s-1. (Dent et al. 2009), and with an estimated inclination to the line-of-sight to the central cluster of ~40° ± 5° (Schneps et al. 1980; Gahm et al. 2006).
The velocity pattern is remarkably smooth. The globulettes all move with similar velocities, +0.5 ± 2.1 km s-1, very close to the velocities obtained at various positions along the ring. With an inclination of 40° it follows that the system of globulettes, shells, and trunks expands at velocities of ~22 km s-1 from the central cluster. The two objects farther out from the ring, RN C and 63, have the highest positive velocities, +2.8 km s-1 and +3.4 km s-1, respectively. This is entirely consistent with an expansion velocity of 22 km s-1, since in a spherically expanding system their inclination is ≈60°. We did not consider here the geometry proposed by Dent et al. (2009), who in an attempt also to include shell structures southeast of the cluster defined an expanding molecular ring centred far south of the cluster, and inclined by ≈ 60° (or ≈30° from the sky plane). This model implies a much higher expansion velocity of ~30 km s-1. For the northwestern area, at focus of the present investigation, we note that Viner et al. (2009) obtained a line width of 22 km s-1 from the H 110α recombination line, consistent with our result. For the same area Celnik (1985) derived line widths of 15 and 31 km s-1 from the He 112α and H 112α lines, respectively.
RN D, seen in projection to the cluster, also has a comparatively large positive velocity, +2.4 km s-1, consistent with the value given in Dent et al. (2009). In this direction one expects velocities of ~–3 km s-1 for objects in the ring system. Hence, it appears that this isolated object seen against the central cavity has a different history than the ring system.
The difference in radial velocity of globulettes and adjacent shell structures rarely exceeds 2 km s-1. For example, RN 101 and 110 are moving with the most negative velocities in our sample, –2.4 km s-1 and –4.0 km s-1, but so does Shell D with –4.4 km s-1. The globulettes are connected by thin filaments to Shell D.
 |
Fig. 10 13CO(1–0) spectra obtained for the tiny globulette RN 95 at on-position (above) and off-position (+30″, 0″). |
Figure 9 shows the profile obtained from the eastern part of the Claw (Claw E). A two-component Gaussian decomposition gives a narrow main component centred at +1.4 km s-1 (FWHM = 0.8 km s-1), and a weaker broader component at +0.7 km s-1 (FWHM = 2.5 km s-1). The western part of the Claw was included in the CO map of the Wrench by Gahm et al. (2006) and was found to move at ≈+0.0 km s-1. Hence, Claw E is red-shifted relative to the western part of the Claw by ~+1.2 km s-1, which shows that the Claw as a whole rotates with about the same speed and the same direction as the Wrench, which is located just south of the Claw.
RN 91, 93, 94, and 95 in the string east of the Claw (see Fig. 1) have similar velocities, ~+1.2 km s-1. RN 93 and 95 are larger than 91 and 94, respectively. Because these pairs are separated by only ≈12″, the emission from the smaller globulettes has entered the radio beams, and there is also weak extended CO-emitting gas at similar velocities in this area. However, as demonstrated from the 13CO(1–0) spectra of RN 95 in Fig. 10, there is no problem to distinguish the globulette signal, which is detected in all transitions. The isolated object RN 88, just south of the string, is slightly blue-shifted in comparison, moving at −0.3 km s-1. RN 88 is the smallest object in our survey, and the identification is tricky. However, the line ratios of the blue-shifted component are similar to the ratios observed in other globulettes, whereas the ratios in the red-shifted component are not.
4.5. Local mass motions
We now take a closer look at three objects, RN 5, 40, and 129, which show more complex line profiles, an indication that additional local gas motions are present.
 |
Fig. 11 Line profiles obtained for the central position of RN 5 show a weak component, blue-shifted relative to the main component. The strongest lines are from 12CO and the weaker from 13CO. Lines from (2–1) transitions are drawn as curves, and from (3–2) transitions as histograms. |
The most prominent wing feature is observed for RN 5, and in the APEX data the
12CO(2–1) transition is strongest and the 13CO(3–2) weakest as
seen in Fig. 11. In RN 40 all
transitions have
similar intensities in the wing, while in RN 129 the two higher
transitions are
of nearly the same intensity, but the (1–0) intensity is also strong. A common feature in
RN 5, 40, and 129 is that the 12CO(1–0) line is broader than that in the (3–2)
and (2–1) transitions. The velocity of the (1–0) peak intensity is also shifted towards
the wing.
A two-component Gaussian fit to the Onsala profiles of RN 5 indicates that the weaker blue-shifted component moves with a velocity of ~1.4 km s-1 relative to the main component. This object has a long and very pronounced tail extending to the west from the core (see Field 2, Fig. 1); we identify the blue-shifted emission as coming from this tail. Since the main line component is comparatively broad, reaching FWHM = 2.6 km s-1 in the 12CO(2–1) line, we mapped the region in 12CO(1–0) over a nine-grid matrix with steps of 10″ to search for any indication of outflows from an imbedded source. The CO-line in question can best be described by two components, but the line is optically very thick, and self-absorption may affect the line shapes. Our map does not reveal any systematic mass motions as expected from a bipolar flow, but the blue component is strongest on the western part of the globulette, supporting our suggestion that the blue-shifted emission arises in the tail.
The asymmetric line profiles of RN 129 are best seen in lines of
(Fig. 4), which are the most optically thick lines. RN 129 also
has a pronounced tail, or rather plume, extending to the north and northeast of the core
(see Field 19, Fig. 1). As for RN 5, we identify the
blue-shifted component with emission from this tail, which then would expand in our
direction with a velocity of ~0.6 km s-1 relative to the core. RN 129 and RN 5
are the most massive globulettes in our sample, but RN 122, which is less massive, also
has a distinct tail and a blue wing (Sect. 4.3).
Finally, RN 40 has a blue-shifted wing present in the 12CO(3–2) and (2–1) lines. In addition, the 12CO(1–0) line is broader than that observed in the two higher transitions, and its central velocity is more blue-shifted than the other lines. RN 40 is the massive end of a finger-like extension connected to the shell. In this case one expects that the emission from the connecting filament is blue-shifted relative to the head, because the massive core has been lagging behind in the acceleration of the shell, just as for elephant trunks (Gahm et al. 2006).
4.6. Background components
Seven globulettes show significantly red-shifted background components. An example of this is shown in Fig. 12 with the 13CO and HCO+ spectra obtained towards the central position of RN 5. The background component at ~+18 km s-1 has about the same spectral appearance over our nine-grid map. Most background components have velocities of around +17 km s-1, and in the maps in Dent et al. (2009) this red-shifted gas extends over large areas in the upper part of the Rosette Nebula. This component is commonly identified with gas at the remote side of the nebula.
 |
Fig. 12 13CO(1–0) (top) and HCO+(1–0) (bottom) spectra from the central position of RN 5. The globulette signal is at +2 km s-1, and the component at +18 km s-1 comes from the background shell. |
It is then puzzling that since the central cluster has a radial velocity of +17 km s-1, a remote shell in a spherical, expanding system is expected to move at ~+34 km s-1, and not at the cluster velocity. If the +17 km s-1 component indeed comes from a remote shell, one would infer that the nebula is not symmetric, but shaped more like a cone, a “champagne flow” extending from the base of the nebula at the border of the giant molecular cloud extending to the southeast of the cluster.
However, on radio continuum maps of the Rosette complex provided in Graham (1982) the H ii region appears as a very round object indeed. Moreover, the central velocities of the radio recombination lines of H 110α, He 112α, and H 112α all fall around +17 km s-1 (Celnik1985; Viner et al. 2009). As referred to above, the corresponding line widths range from 15 to 31 km s-1, which is more consistent with a spherically expanding system. There are no foreground obscuring clouds in the area in question, so the implication appears to be that the molecular background emission comes from an extended shell that is located in the middle of the H ii region. Alternatively, if the emission does come from a shell bordering the remote side of the nebula, then this shell has not yet reached its final expansion velocity.
4.7. Nature of globulettes
We conclude that on the whole the masses estimated above from our molecular line observations with APEX are in the same range as those obtained from the NOT Hα survey in Paper I. This agreement is notable, since the former mass relates to the amount of gas in the globulettes, while the latter mass relates to the amount of dust, where a gas-to-dust ratio of 100 was assumed. The globulettes appear as well-confined objects of relatively uniform density, dropping sharply close to the surface. Our J and Pβ images show that some globulettes in addition contain very dense cores, as evidenced also by the high extinction found in one direction through RN 35 (Sect. 4.1).
In the model simulations by e.g. Kuutmann (2007) and Henney et al. (2009) any clump exposed to radiation from central stars in a nebulae will develop a photoionized layer on the side facing the OB stars, and also a tail of molecular gas driven in the opposite direction. It is then puzzling that none of our selected objects shows any sign of bright rims in Hα, with the exception of RN D, which is surrounded by a circular halo consistent with its location in the foreground to the cluster stars. However, the larger globulettes in the Rosette Nebula have bright rims in Pβ and pronounced tails. Some smaller globulettes also show faint Pβ emission extending over their surfaces, which may flag the presence of bright rims on the remote sides of the globulettes. Such rims would be entirely obscured in the Hα images. Since the globulettes are all located on our side of the complex, the side exposed to radiation is partly hidden from us, and elephant trunks in the area show clear evidence of remote rims as well in Hα. The observed rims are much thinner than those encountered in the model simulations, which may be a consequence of the high density encountered already below the surface. Such thin rims may escape detection in the Hα images, especially since the background emission is high. The thin layer of H2 fluorescent emission bordering some globulettes also indicates that the gas is dense and in molecular form just below the surface (Sect. 3.2). The global evolution of giant H II regions has been modelled in Arthur et al. (2011) and has been followed up more recently in W. Henney and collaborators (Henney 2013, priv. comm.), showing in more detail how small-scale cold clumps can erode from pillars and shells. It appears that these clumps have much in common with the globulettes studied here, and interestingly, the model clumps can be seen with or without a bright rim, depending on the viewing angle.
We have concluded that the velocity pattern observed for the globulettes, which are distributed over a large area in the Rosette Nebula, is very smooth. The fact that the globulettes move with velocities similar to the inner remnant shell in the foreground of the nebula strongly suggests that the globulettes once were detached from eroding structures in the shell. Several objects are still connected by thin filaments to larger shell structures, and as the larger elephant trunks, they obtain this form since the more massive clump lags behind in the general expansion of the shell. We envision that in a next phase the thin filaments will erode and disappear, and the clumps will become isolated globulettes. The string of globulettes east of the Claw may have formed recently from a filament that became detached from this rotating complex. Other quite isolated globulettes, far from any larger block of molecular gas and dust, must have been separated from larger blocks long ago.
We therefore expect a range of ages among the globulettes as counted from the moment of detachment. There is no indication that some objects were accelerated even more since they detached, or that they were ejected from trunks and shells by some mechanism. If globulettes were subject to acceleration from the rocket effect described in Sect. 1, one would expect a much larger spread in radial velocity among the objects and a systematic blue-shift relative to the shells by 5 to 10 km s-1.
Possibly, many of the round isolated globulettes represent denser cores that were once encapsulated in less dense shells that since then have evaporated and lost most of the signatures of bright rims and tails. Physical parameters for the expanding plasma in the area of the northwestern ring were extracted in Gahm et al. (2006) from the studies of radio lines cited in Sect. 4.4, and it was found in Paper I that the external pressure acting on the globulettes is comparable with the internal gas pressure. These external forces from the surrounding warm and turbulent medium help to confine the globulettes, and from simple virial arguments it was concluded that most objects could be gravitationally unstable and may form free-floating planetary-mass objects or brown dwarfs, which will shoot out into galactic space with velocities of ~20 km s-1. In the model simulations of Kuutmann (2007), based on sizes and densities from Paper I, this scenario is less evident, at least so for the smaller globulettes. A new set of calculations is warranted with more advanced cooling functions than used before. Our discovery of denser cores inside some of the larger globulettes will alter the conditions assumed for their evolution. Obviously, such dense cores can be in a state of collapse.
5. Conclusions
Globulettes in the northwestern and northern part of the Rosette Nebula were observed for emission from the lowest transitions in 12CO, 13CO and HCO+, and a sample was observed also for higher transitions in CO. Masses and densities of the objects were estimated from a model assuming that the globulettes have cool and dense cores surrounded by warm but dense envelopes. In addition, NIR broad-band and narrow-band Paschen β and H2 images were collected of fields containing globulettes. From this survey we conclude the following:
-
*
The models were able to provide estimates only of the maximumand minimum mass of each globulette. The average masses rangefrom about 50 to 500 MJ, and are similar to those derived in Paper I based on column densities of dust.
-
*
The density inside globulettes is high, nH ~ 104 cm-3, also close to surface, where the gas is in molecular form, and give rise to thin layers of fluorescent H2 emission. Thin bright rims were detected also both in Pβ, which might escape detection in the optical due to background emission or because they are partly hidden on the remote sides. Several globulettes are very opaque, also in the NIR, and contain dense cores.
-
*
The internal motions are weak, but some objects eject gas tails directed away from the central cluster. The globulettes are distributed over an area spanning 13 pc in projected distance. They all move with similar velocities, +0.5 ± 2.1 km s-1. With an inclination of 40° the entire system of globulettes, shells, and trunks expands at velocities of ~22 km s-1 from the central cluster. There is no indication that globulettes are subject to additional acceleration from the rocket effect. Line components connected to a remote shell were observed at several positions at velocities ~+17 km s-1. These velocities are inconsistent with a spherically symmetric expanding H ii region, and other geometries and expansion scenarios must be considered.
-
*
Extinction for stars in the NIR fields were measured for stars in the direction of globulettes and shell structures, and for stars in open areas. No evidence of objects embedded in globulettes was found.
The globulettes investigated are in different evolutionary phases. We found evidence that they detach as clumps from elephant trunks and shell structures and lag behind in the general expansion of the molecular shell. From the interaction with stellar light and the surrounding plasma the objects develop tails and bright rims and erode further to form isolated, roundish objects of high density. Such cores may collapse to form planetary-mass objects or brown dwarfs, which would shoot out into interstellar space at high velocity.
Molecular line observations with an antenna, such as the interferometer ALMA, would provide key information on the conditions prevailing in the interior of globulettes that would be of significant importance to our discussion of their fate. Finally, more detailed comparisons between current model simulations of small-scale molecular structures evolving in H ii region would be of great interest and can now be realised.
Online material
Data and line parameters for observed globulettes.
Appendix A: Spectral atlas
Appendix A.1: Spectra collected at APEX and Onsala
 |
Fig. A.1 CO spectra obtained for on-source-positions of the globulettes observed at both
at APEX and Onsala in the |
Appendix A.2: Spectra collected at Onsala
 |
Fig. A.2 Left: CO spectra obtained for on-source-positions of the
globulettes observed only at Onsala in the
|
Acknowledgments
This work was supported by the Magnus Bergvall Foundation. M.M. acknowledges the support from the Finnish Graduate School in Astronomy and Space Physics. L.H. acknowledges the support from the Finnish Ministry of Education project Utilizing Finland’s membership in the European Southern Observatory and the Academy of Finland under grant 132291. We are most grateful to the referee, William Henney, for some very valuable comments.
References
- Arthur, S. J., Henney, W. J., Mellema, G., De Colle, F., & Vásquez-Semadeni, E. 2011, MNRAS, 414, 1747 [NASA ADS] [CrossRef] [Google Scholar]
- Bally, J., O’Dell, C. R., & McCaughrean, M. J. 2000, AJ, 119, 2919 [NASA ADS] [CrossRef] [Google Scholar]
- Bertin, E., & Arnouts, S. 1996, A&AS, 117, 393 [NASA ADS] [CrossRef] [EDP Sciences] [Google Scholar]
- Bohlin, R. C., Savage, B. D., & Drake, J. F. 1978, ApJ, 224, 132 [NASA ADS] [CrossRef] [Google Scholar]
- Burgasser, A. J., Gelino, C. R., Cushing, M. C., & Kirkpatrick, J. D. 2012, ApJ, 745:26 [NASA ADS] [CrossRef] [Google Scholar]
- Carlqvist, P., Gahm, G. F., & Kristen, H. 2003, A&A, 403, 399 [NASA ADS] [CrossRef] [EDP Sciences] [Google Scholar]
- Celnik, W. E. 1985, A&A, 144, 171 [NASA ADS] [Google Scholar]
- Celnik, W. E. 1986, A&A, 160, 287 [NASA ADS] [Google Scholar]
- De Marco, O., O’Dell, C. R., Gelfond, P., Rubin, R. H., & Glover, S. C. O. 2006, AJ, 131, 2580 [NASA ADS] [CrossRef] [Google Scholar]
- Dent, W. R F.,Hovey, G., Dewdney, P. E., et al. 2009, MNRAS, 395, 1805 [NASA ADS] [CrossRef] [Google Scholar]
- Gahm, G. F., Carlqvist, P., Johansson, L. E. B., & Nicolić, S. 2006, A&A, 454, 201 [NASA ADS] [CrossRef] [EDP Sciences] [Google Scholar]
- Gahm, G. F., Grenman, T., Fredriksson, S., & Kristen, H. 2007, AJ, 133,1795 (Paper I) [NASA ADS] [CrossRef] [Google Scholar]
- Gelino, C. R., Kirkpatrick, J. D., Cushing, M. C., et al. 2012, AJ, 142:57 [Google Scholar]
- González-Alfonso, E., & Cernicharo, J. 1994, ApJ, 430, L125 [NASA ADS] [CrossRef] [Google Scholar]
- Graham, D. A., Haslam, C. G., Salter, C. J., & Wilson, W. E. 1982, A&A, 109, 145 [NASA ADS] [Google Scholar]
- Grenman, T. 2006, Licentiate Thesis, Luleå University of Technology (ISSN 1402-1757) [Google Scholar]
- Henney, W. J., Arthur, S. J., De Colle, F., & Mellema, G. 2009, MNRAS, 398, 157 [NASA ADS] [CrossRef] [Google Scholar]
- Hensberge, H., Pavlovski, K., & Verschueren, W. 2000, A&A, 358, 553 [NASA ADS] [Google Scholar]
- Herbig, G. H. 1974, PASP, 86, 604 [NASA ADS] [CrossRef] [Google Scholar]
- Hester, J. J., Scowen, P. A., Sankrit, R., et al. 1996, AJ, 111, 2349 [NASA ADS] [CrossRef] [Google Scholar]
- Ito, M., Yamashita, T., Sako, S., et al. 2008, ApJ, 672, 398 [NASA ADS] [CrossRef] [Google Scholar]
- Jayawardhana, R., & Ivanov, V. D. 2006, Science, 313, 1279 [NASA ADS] [CrossRef] [PubMed] [Google Scholar]
- Juvela, M. 1997, A&A, 322, 943 [NASA ADS] [Google Scholar]
- Kuutmann A., 2007, Master Thesis, Stockholm University [Google Scholar]
- Lombardi, M., & Alves, J. 2001, A&A, 377, 1023 [NASA ADS] [CrossRef] [EDP Sciences] [Google Scholar]
- Mäkelä, M. M., & Haikala, L. K. 2013, A&A, 550, A83 [NASA ADS] [CrossRef] [EDP Sciences] [Google Scholar]
- Mellema, G., Raga, A. C., Cantó, J., et al. 1998, A&A, 331, 335 [NASA ADS] [Google Scholar]
- Minkowski, R. 1949, PASP, 61, 151 [NASA ADS] [CrossRef] [Google Scholar]
- Ogura, K., & Ishida, K. 1981, PASJ, 33, 149 [NASA ADS] [Google Scholar]
- Quanz, S. P., Goldman, B., Henning, T., et al. 2010, ApJ, 717, 693 [NASA ADS] [CrossRef] [Google Scholar]
- Reipurth, B., Corporon, P., Olberg, M., & Tenorio-Tagle, G. 1997, A&A, 327, 1185 [NASA ADS] [Google Scholar]
- Reipurth, B., Raga, A., & Heathcote, S. 2003, AJ, 126, 1925 [NASA ADS] [CrossRef] [Google Scholar]
- Róman-Zúñiga, C. G. 2008, in Handbook of Star Forming Regions, ed. B. Reipurth (ASP), 1, 1 [Google Scholar]
- Schneps, M. H., Ho, P. T. P., & Barret, A. H. 1980, ApJ, 240, 84 [NASA ADS] [CrossRef] [Google Scholar]
- Smith, N., Bally, J., & Morse, J. A. 2003, ApJ, 587, L105 [NASA ADS] [CrossRef] [Google Scholar]
- Smith, N., Bally, J., & Walborn, N. R. 2010, MNRAS, 405, 1153 [NASA ADS] [Google Scholar]
- Sumi, T., Kamiya, K., Bennett, D. P., et al. 2011, Nature, 473, 349 [NASA ADS] [CrossRef] [PubMed] [Google Scholar]
- Thackeray, A. D. 1950, MNRAS, 110, 524 [NASA ADS] [Google Scholar]
- Veras, D., Crepp, J. R., & Ford, E. B. 1998, A&A, 332, L5 [Google Scholar]
- Viner, M. R., Vallée, J. P., & Hughes, V. A. 1979, AJ, 84, 1335 [NASA ADS] [CrossRef] [Google Scholar]
- Wang, J., Feigelson, E. D., Townsley, L. K., et al. 2010, ApJ, 716, 474 [NASA ADS] [CrossRef] [Google Scholar]
- White, G. J., Lefloch, B., Fridlund, C. V. M., et al. 1997, A&A, 323, 931 [NASA ADS] [Google Scholar]
All Tables
All Figures
|
Fig. 1 Cuts from Hα images presented in Paper I of different fields in the Rosette Nebula, including globulettes and positions in shells that were selected for the subsequent analysis, as numbered in Table 1. The fields all span 4.4′ × 3.4′, and are numbered as in Paper I. The bottom second panel is a blown-up Hα image of the dense globulette RN 88, diameter ~ 6 ″ in Field 15. The string of globulettes in Field 15 is connected to a long filamentary shell containing a claw-like feature. The upper part of the prominent elephant trunk “the Wrench” is seen southwest of “the Claw”. North is up and east is to the left. |
| In the text | |
|
Fig. 2 Overview of part of the Rosette Nebula composed from images in Hα (red) and O iii (green). Objects not included in the NOT survey are marked, as are some NOT objects for orientation. The NIR fields are depicted as white boxes, covering from right to left Fields 7, 8, 15, and 19. The elephant trunk the Wrench is in the middle of the image with the Claw at its upper end (image: Canada-France-Hawaii Telescope). |
| In the text | |
|
Fig. 3 13CO(1–0) emission towards RN 40 over the LSR velocity range –8 to +9 km s-1. The top panel shows a 10-sigma detection at the on-position, and the lower panel shows the non-detection at the off-position (30″, − 30″) with an rms of 45 mK. |
| In the text | |
|
Fig. 4 Examples of spectra obtained with APEX (upper panels) and at OSO (lower panels) for globulettes of different size. From left to right: RN 9 (small), 114 (medium), and 129 (large). Upper panels: the 12CO(3–2), 13CO(3–2), 12CO(2–1), and 13CO(2–1) lines are plotted in black, green, red, and blue, respectively. Lines from (2–1) transitions are drawn as curves, and from (3–2) transitions as histograms. Lower panels: 12CO(1–0) profiles (thick); 13CO(1–0) profiles (green, thin). The 13CO(1–0) lines are multiplied by ten (RN 9) or three (RN 114 and 129). RN 9 is identified with the narrow component at ~0 km s-1, while the broader component at ~+2 km s-1 comes from more extended gas. In RN 129 a “blue” wing is present in several lines. |
| In the text | |
|
Fig. 5 Jittered Js, H, and Ks images of an area in Field 19. The cores of RN 114, 122 and 129 are opaque in the Js filter. |
| In the text | |
|
Fig. 6 Upper panels: continuum, H2 and the H2 – continuum difference images of an area in Field 15 where the Claw and the string of small-size globulettes are visible in the two latter images. Lower panels: difference images of areas in Fields 7, 8, and 15. The locations of some globulettes and one shell position are marked for orientation. |
| In the text | |
|
Fig. 7 Left and middle panels: 1.26 μm continuum and Pβ images of an area in Field 15. The Claw at the centre is dark in the Pβ image, and so are some of the tiny globulettes to the east of the Claw. Right panel: the opaque cores of RN 114, 122, and 129 are distinct on this Pβ image of an area in Field 19 (see also Fig. 5). |
| In the text | |
|
Fig. 8 (J − H)/(H − Ks) colour–colour diagrams of stars from Fields 7 and 8. Stars outside the obscured region are plotted in the left panel, and those in the direction of shells and globulettes in the right panel. The stars detected inside globulettes are plotted as diamonds. Also plotted are the loci of unreddened giant (red, thick) and main-sequence (black, thin) stars. The direction of interstellar extinction follows the slashed lines and the vector shows a corresponding visual extinction of 5 mag. |
| In the text | |
|
Fig. 9 12CO(1–0) profile of the eastern part of the Claw, which is asymmetric, but is as a whole red-shifted relative to the western part of the Claw. A two-component Gaussian fit to the profile is also shown (details in the text). |
| In the text | |
|
Fig. 10 13CO(1–0) spectra obtained for the tiny globulette RN 95 at on-position (above) and off-position (+30″, 0″). |
| In the text | |
|
Fig. 11 Line profiles obtained for the central position of RN 5 show a weak component, blue-shifted relative to the main component. The strongest lines are from 12CO and the weaker from 13CO. Lines from (2–1) transitions are drawn as curves, and from (3–2) transitions as histograms. |
| In the text | |
|
Fig. 12 13CO(1–0) (top) and HCO+(1–0) (bottom) spectra from the central position of RN 5. The globulette signal is at +2 km s-1, and the component at +18 km s-1 comes from the background shell. |
| In the text | |
|
Fig. A.1 CO spectra obtained for on-source-positions of the globulettes observed at both
at APEX and Onsala in the |
| In the text | |
|
Fig. A.2 Left: CO spectra obtained for on-source-positions of the
globulettes observed only at Onsala in the
|
| In the text | |
Current usage metrics show cumulative count of Article Views (full-text article views including HTML views, PDF and ePub downloads, according to the available data) and Abstracts Views on Vision4Press platform.
Data correspond to usage on the plateform after 2015. The current usage metrics is available 48-96 hours after online publication and is updated daily on week days.
Initial download of the metrics may take a while.