Free Access
Fig. 3
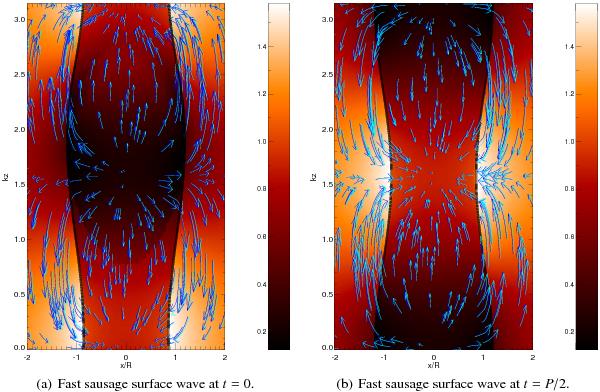
Longitudinal cut of a fast sausage surface wave at two different times. The background colour indicates the density, which is used as a proxy for the intensity. The flux-tube boundary is indicated by a black line. The arrows indicate the plasma displacement.
This figure is made of several images, please see below:
Current usage metrics show cumulative count of Article Views (full-text article views including HTML views, PDF and ePub downloads, according to the available data) and Abstracts Views on Vision4Press platform.
Data correspond to usage on the plateform after 2015. The current usage metrics is available 48-96 hours after online publication and is updated daily on week days.
Initial download of the metrics may take a while.