Free Access
Fig. 6
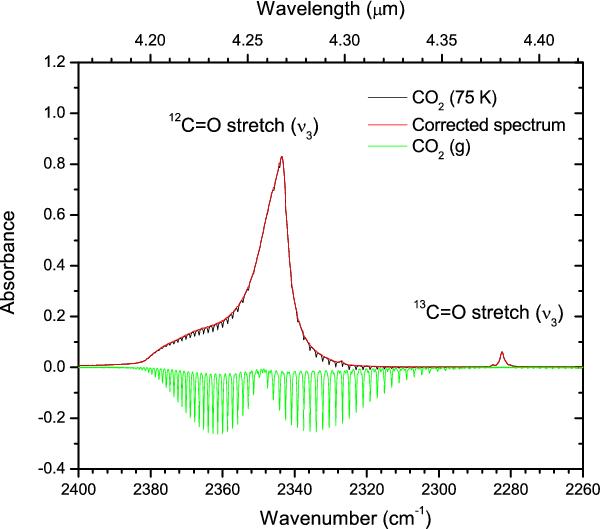
Spectral corrections performed on the CO2 (ν3) mode. Rotational fine-structure of gaseous CO2 (green trace), overlapping with the CO2 (ν3) ice band, is subtracted from the raw spectrum (black trace). The corrected spectrum is shown in red.
Current usage metrics show cumulative count of Article Views (full-text article views including HTML views, PDF and ePub downloads, according to the available data) and Abstracts Views on Vision4Press platform.
Data correspond to usage on the plateform after 2015. The current usage metrics is available 48-96 hours after online publication and is updated daily on week days.
Initial download of the metrics may take a while.