Fig. 5

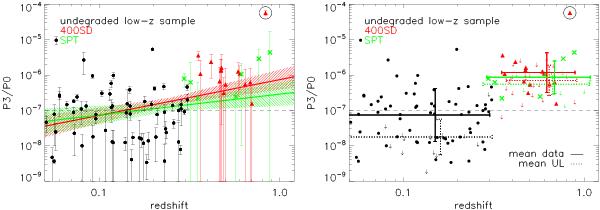
Undegraded P3/P0-z relation. Low-z (black circles), 400SD (red triangles), and SPT (green crosses) sample. Left: the BCES fit to sample I is shown as a red line while the green line indicates the fit to sample II. The dashed areas show the 1-σ error of best-fitting values. Fitting parameters are given in Table 2. The very structured 400SD cluster 0152−1358 at z ~ 0.8 with P3/P0 > 10-5 is marked by a black circle. Excluding this cluster from sample I gives consistent results. In addition we show the P3/P0 boundary at 10-7 (dashed line). Right: same data points as on the left, but including upper limits as downward arrows. For all three samples the solid lines give the mean of the log distribution of the significant data points including the 1-σ errors, while the dotted lines show the mean of the upper limits.
Current usage metrics show cumulative count of Article Views (full-text article views including HTML views, PDF and ePub downloads, according to the available data) and Abstracts Views on Vision4Press platform.
Data correspond to usage on the plateform after 2015. The current usage metrics is available 48-96 hours after online publication and is updated daily on week days.
Initial download of the metrics may take a while.


