| Issue |
A&A
Volume 555, July 2013
|
|
|---|---|---|
| Article Number | A6 | |
| Number of page(s) | 8 | |
| Section | Galactic structure, stellar clusters and populations | |
| DOI | https://doi.org/10.1051/0004-6361/201321437 | |
| Published online | 19 June 2013 | |
Stellar substructures in the solar neighbourhood
II. Abundances of neutron-capture elements in the kinematic Group 3 of the Geneva-Copenhagen survey
1
Institute of Theoretical Physics and Astronomy, Vilnius
University,
A. Gostauto 12,
01108
Vilnius,
Lithuania
e-mail: This email address is being protected from spambots. You need JavaScript enabled to view it.
; This email address is being protected from spambots. You need JavaScript enabled to view it.
; This email address is being protected from spambots. You need JavaScript enabled to view it.
2
Niels Bohr Institute, Copenhagen University,
Juliane Maries Vej
30, 2100
Copenhagen,
Denmark
e-mail:
This email address is being protected from spambots. You need JavaScript enabled to view it.
Received: 8 March 2013
Accepted: 18 April 2013
Abstract
Context. The evolution of chemical elements in a galaxy is linked to its star formation history. Variations in star formation history are imprinted in the relative abundances of chemical elements produced in different supernova events and asymptotic giant branch stars.
Aims. We determine detailed elemental abundances of s- and r-process elements in stars belonging to Group 3 of the Geneva-Copenhagen survey and compare their chemical composition with Galactic disc stars. The aim is to look for possible chemical signatures that might give information about the formation history of this kinematic group of stars, which is suggested to correspond to remnants of disrupted satellites.
Methods. High-resolution spectra were obtained with the FIES spectrograph at the Nordic Optical Telescope, La Palma, and were analysed with a differential model atmosphere method. Comparison stars were observed and analysed with the same method.
Results. Abundances of chemical elements produced mainly by the s-process are similar to those in the Galactic thin-disc dwarfs of the same metallicity, while abundances of chemical elements produced predominantly by the r-process are overabundant. The similar elemental abundances are observed in Galactic thick-disc stars.
Conclusions. The chemical composition together with the kinematic properties and ages of stars in Group 3 of the Geneva-Copenhagen survey support a gas-rich satellite merger scenario as the most likely explanation for the origin. The similar chemical composition of stars in Group 3 and the thick-disc stars might suggest that their formation histories are linked.
Key words: stars: abundances / Galaxy: disk / Galaxy: formation / Galaxy: evolution
© ESO, 2013
1. Introduction
Our understanding of the global star formation history of the Milky Way galaxy remains incomplete. We need to determine the detailed age and spatial distributions, space motions, and elemental abundances both globally and for every substructure. It is important to understand effects of accreted satellites, how they depend on the time of accretion, their initial orbits, masses and density profiles, since these factors impose different scenarios of the tidal disruption of satellites and the distribution of debris to different Galactic components (cf. Wyse 2009; van der Kruit & Freeman 2011, and references therein).
A number of stellar streams, moving and kinematic groups were identified in our Galaxy (Zuckerman & Song 2004; Helmi 2008; Klement et al. 2009; Sesar et al. 2012, and references therein). Some of them are suspected to originate from accreted satellites. Signatures of past accretions in the Milky Way may be identified from correlations between stellar orbital parameters, such as apocentre (A), pericentre (P), and z-angular momentum (Lz), the so-called APL space. Helmi et al. (2006) identified three new coherent groups of stars in the Geneva-Copenhagen survey (Nordström et al. 2004) and suggested that those might correspond to remains of disrupted satellites. In the kinematic U–V plane, the investigated stars are distributed in a banana-shape, whereas the disc stars define a centrally concentrated clump. At the same time, in the U–W plane the investigated stars populate mostly the outskirts of the distributions. Both the U and W distributions are very symmetric. The investigated stars have a lower mean galactic rotational velocity than the Milky Way disc stars in the W–V plane. These characteristics are typical for stars associated with accreted satellite galaxies (Helmi 2008; Villalobos & Helmi 2009). Stars in the identified groups also cluster around regions of roughly constant eccentricity (0.3 ≤ ϵ < 0.5).
In Stonkutė et al. (2012, Paper I), we started to investigate the detailed chemical composition of stars belonging to kinematic groups of the Geneva-Copenhagen survey (Helmi et al. 2006). Group 3, which we decided to investigate first, is the most metal-deficient and consists of 68 stars. It differs from the other two groups by slightly different kinematics, particularly in the vertical (z) direction.
From high-resolution spectra, we measured abundances of iron group and α-elements in 21 stars. All stars in Group 3 except one have a similar metallicity, their age is of about 12 Gyr. The average [Fe/H]1 value of the 20 stars is −0.69 ± 0.05 dex. All stars are overabundant in oxygen and α-elements compared with Galactic thin-disc dwarfs and the Galactic evolution model (Pagel & Tautvaišienė 1995). This abundance pattern has similar characteristics as the Galactic thick disc. The similar chemical composition of stars in Group 3 and the thick-disc stars might suggest that their formation histories are linked. The kinematic properties of this stellar group fit a gas-rich satellite merger scenario (Brook et al. 2004, 2005; Dierickx et al. 2010; Wilson et al. 2011; Di Matteo et al. 2011).
The neutron-capture elements as well as α-elements are very sensitive indicators of galactic evolution (Pagel & Tautvaišienė 1997; Tautvaišienė et al. 2007; Sneden et al. 2008; Tolstoy et al. 2009; Ting et al. 2012, and references therein). If stars have been formed in different environments, they normally have different element-to-iron ratios for a given metallicity. In this work, we determine abundances of s- and r-process elements by means of high-resolution spectroscopy for stars in Group 3.
The r-process, which requires a high neutron flux level (with many n-captures over a timescale of a fraction of a second), is believed to occur in supernova explosions. The s-process, which in contrast requires a lower neutron flux (with a typical n-capture taking many years), is generally thought to occur during the double-shell burning phase of low- (1–3 M⊙) or intermediate-mass (4–7 M⊙) thermally pulsing asymptotic giant branch (AGB) stars.
We present n-capture element abundances (specifically Y, Zr, Ba, La, Ce, Pr, Nd, Sm, and Eu) for 21 stars of Group 3 and six comparison stars and compare them with the Galactic disc pattern.
2. Observations and analysis
Echelle spectra of the programme and comparison stars were obtained with the high-resolution FIbre-fed Echelle Spectrograph (FIES) on the Nordic Optical 2.5 m telescope. This spectrograph gives spectra of resolving power R ≈ 68 000 in the wavelength range of 3680–7270 Å. The spectra were exposed to reach a signal-to-noise ratio higher than 100. Reductions of CCD images were made with the FIES pipeline FIEStool2, which performs a complete reduction.
The spectra were analysed using a differential model atmosphere technique. The spectral synthesis was performed for the abundance determinations of all investigated chemical elements.
The program BSYN, developed at the Uppsala Astronomical Observatory, was used to carry out the calculations of synthetic spectra. A set of one-dimensional, hydrostatic, plane-parallel, line-blanketed, constant-flux LTE model atmospheres (Gustafsson et al. 2008) was taken from the MARCS stellar model atmosphere and flux library3.
Calibrations to the solar spectrum Kurucz (2005) were made for all the spectral regions investigated. For this purpose we used the solar model-atmosphere from the set calculated in Uppsala with a microturbulent velocity of 0.8 km s-1, as derived from Fe i lines. The atomic oscillator strengths for stronger lines of iron and other elements were taken from Gurtovenko & Kostyk (1989). The Vienna Atomic Line Database (VALD; Piskunov et al. 1995) was extensively used in preparing the input data for the calculations. In addition to thermal and microturbulent Doppler broadening of lines, atomic line broadening by radiation damping and van der Waals damping were considered in calculating the abundances. Radiation damping parameters of lines were taken from the VALD database. In most cases the hydrogen pressure damping of metal lines was treated using the modern quantum mechanical calculations by Anstee & O’Mara (1995), Barklem & O’Mara (1997), and Barklem et al. (1998). When using the Unsöld (1955) approximation, correction factors to the classical van der Waals damping approximation by widths (Γ6) were taken from Simmons & Blackwell (1982). For all other species a correction factor of 2.5 was applied to the classical Γ6 (Δlog C6 = + 1.0), following Mäckle et al. (1975). For lines stronger than W = 100 mÅ in the solar spectrum the correction factors were selected individually by inspecting the solar spectrum.
Effective temperature, gravity, [Fe/H], and microturbulent velocity values of the programme and comparison stars have been taken from Paper I where these values were derived using spectroscopic methods. A stellar rotation was taken into account using values of v sin i from Holmberg et al. (2007).
Adopted solar elemental abundances.
Abundances of the investigated chemical elements were determined from up to seven Y ii lines at 4883.7, 4982.1, 5087.4, 5200.4, 5289.8, 5402.8, and 5728.9 Å; from the Zr i lines at 4687.8, 4772.3, 4815.6, 5385.1, 6134.6, 6140.5, and 6143.2 Å and Zr ii lines at 5112.3 and 5350.1 Å; from the Ba ii line at 5853.7 Å with the hyperfine structure (HFS) and isotopic composition adopted from McWilliam (1998). The lanthanum abundance was determined from the La ii lines at 4662.5, 4748.7, 5123.0, and 6390.5 Å. To analyse the 4662.5, 5123.0, and 6390.5 Å lines, we adopted the log gf from Lawler et al. (2001a) and HFS patterns from Ivans et al. (2006). The HFS patterns were not provided for the La ii line at 4748.7 Å. This line is very weak, so the broadening by hyperfine splitting can be neglected. Up to five Ce ii lines at 5274.2, 5330.5, 5512.0, 5610.3, and 6043.4 Å were used to determine the abundance of cerium. The praseodymium abundance was determined from the Pr ii lines at 5259.7 and 5322.8 Å with the information on HFS taken from Sneden et al. (2009). We investigated Nd ii lines at 4811.3, 5130.6, 5255.5, 5276.9, 5293.2, 5319.8, and 5385.9 Å; Sm ii lines at 4467.3, 4577.7, and 4791.6 Å. For the Sm ii line at 4467.3 Å the log gf was taken from Lawler et al. (2006), and the HFS patterns from Roederer et al. (2008). For the remaining two lines a hyperfine structure was not taken into account since these lines are very weak and their hyperfine splitting can be neglected (cf. Mishenina et al. 2013). The abundance of europium was determined from the Eu ii lines at 4129.7 and 6645.1 Å. The log gf values for the Eu ii lines and isotope fractions were adopted from Lawler et al. (2001b). An information on the HFS pattern for the Eu ii line at 4129.7 Å was taken from Ivans et al. (2006), and for the line at 6645.1 Å from Biehl (1976). A partial blending of the Eu ii line 6645.1 Å with weak Si i and Cr i lines at 6645.21 Å was taken into account.
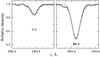 |
Fig. 1 Synthetic spectrum fit to the yttrium line at 5402 Å and barium line at 5853 Å. The observed spectrum for the programme star HD 204848 is shown as dots. The grey lines are synthetic spectra with [Y/Fe] = 0.33 ± 0.10 and [Ba/Fe] = 0.25 ± 0.10, respectively. |
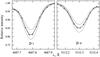 |
Fig. 2 Synthetic spectrum fit to the Zr i line at 4688 Å and Zr ii line at 5112 Å. The grey lines are synthetic spectra with [Zr i/Fe] = 0.40 ± 0.10 and [Zr ii/Fe] = 0.38 ± 0.10, respectively. The observed spectrum for the programme star HD 204848 is shown as dots. |
The line parameters in the intervals of spectral syntheses were compiled from the VALD database. All log gf values were calibrated to fit to the solar spectrum by Kurucz (2005) with solar abundances from Grevesse & Sauval (2000). The adopted solar abundances for the investigated chemical elements are presented in Table 1.
Several fits of the synthetic line profiles to the observed spectra are shown in Figs. 1–5. The best-fit abundances were determined by eye.
2.1. Estimation of uncertainties
The sensitivity of oxygen, alpha, and Fe-peak element abundances to stellar atmospheric parameters were described in Stonkutė et al. (2012). The sensitivity of the abundance estimates to changes in the atmospheric parameters by the assumed errors Δ[El/H] are illustrated for the star HD 224930 (Table 2).
The scatter of the deduced abundances from different spectral lines σ gives an estimate of the uncertainty due to the random errors. The mean value of σ is 0.05 dex, thus the uncertainties in the derived abundances that are the result of random errors amount to approximately this value.
2.2. Comparison with other studies
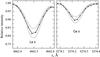 |
Fig. 3 Synthetic spectrum fit to the lanthanum line at 4662 Å and cerium line at 5274 Å. The observed spectrum for the programme star HD 204848 is shown as dots. The grey lines are synthetic spectra with [La/Fe] = 0.20 ± 0.10 and [Ce/Fe] = 0.10 ± 0.10, respectively. |
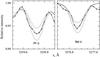 |
Fig. 4 Synthetic spectrum fit to the praseodymium line at 5259 Å and neodymium line at 5276 Å. The observed spectrum for the programme star HD 204848 is shown as dots. The grey lines are synthetic spectra with [Pr/Fe] = 0.20 ± 0.10 and [Nd/Fe] = 0.38 ± 0.10, respectively. |
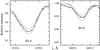 |
Fig. 5 Synthetic spectrum fit to the Eu ii lines at 4129 and 6645 Å. The grey lines are synthetic spectra with [Eu/Fe] = 0.33 ± 0.10 and [Eu/Fe] = 0.37 ± 0.10 for these two lines, respectively. The observed spectrum for the programme star HD 170737 is shown as dots. |
Effects on derived abundances resulting from model changes for the star HD 224930.
Some stars from our sample were previously investigated by other authors. In Table 3 we present a comparison with results by Nissen & Schuster (2010) and Reddy et al. (2006), who investigated several stars in common with our work. Yttrium and barium for six thin-disc stars were analysed previously in Edvardsson et al. (1993). The comparison is presented in Table 3. Our [El/Fe] values agree very well with other studies. The comparison for other chemical elements can be found in Paper I.
Comparison with previous studies.
3. Results and discussion
The elemental-to-iron abundance ratios derived for the programme and comparison stars are presented in Table 4. We recall that BD +35 3659 is not a member of Group 3 and can be considered as a comparison star. For convenience we also present [Fe/H] values determined for these stars in Paper I. The number of lines used for the abundance determination and the line-to-line scatter (σ) are presented as well.
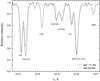 |
Fig. 6 NOT-FIES spectra of the programme stars HD 201889 and BD +73 566. These two spectra are over-plotted to see the difference in spectral lines of elements produced in s-and r-processes while lines of other chemical elements are similar. |
Elemental abundances of Fe and neutron capture elements for the programme and comparison stars.
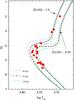 |
Fig. 7 HR diagram of the Group 3 stars. Yi et al. (2001) isochrones representing three different ages and metallicities are shown. The filled circles correspond to the investigated stars with the spectroscopic effective temperatures taken from Paper I. Isochrones are with [α/Fe] = 0.4 dex. |
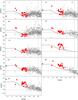 |
Fig. 8 Elemental abundance ratios of stars in Group 3 (filled circles) and comparison stars (open circles). The star BD +35 3659, which was removed from Group 3, is marked by an asterisk. For this comparison the data for Milky Way thin-disc dwarfs are plotted: Mishenina et al. (2013, dots), Mashonkina et al. (2007, crosses), Reddy et al. (2006, 2003, squares), Brewer & Carney (2006, diamonds), Bensby et al. (2005, stars), Koch & Edvardsson (2002, upside down triangles), Gratton & Sneden (1994, triangles), Edvardsson et al. (1993, plus signs). Solid lines show the Galactic thin-disc chemical evolution models by Pagel & Tautvaišienė (1997). Average uncertainties are shown in the box for zirconium. |
The age distribution of the Group 3 stars is seen on a Hertzsprung-Russell (HR) diagram (Fig. 7). The initial age evaluation for Group 3 was 14 Gyr (Holmberg et al. 2007). In Fig. 7 we plot the investigated stars of Group 3 with our spectroscopic effective temperatures (Paper I) and absolute magnitudes Mv taken from Holmberg et al. (2009). We used the Yonsei-Yale single stellar population library by Yi et al. (2001), and its updated version by Demarque et al. (2004). We plotted isochrones of three ages (10, 12, and 14 Gyr) and two metallicities [Fe/H] (−1.0 and −0.50). These two metallicities represent the minimum and maximum values of Group 3 stars. The mean metallicity of investigated Group 3 stars is equal to −0.69 ± 0.05 dex. The overall features of the HR diagram seem to be well reproduced by the 12 Gyr isochrone. We note that ages of stars belonging to the Arcturus and AF06 stellar streams also range from 10 to 14 Gyr (Ramya et al. 2012).
One star in Group 3 is rich in elements produced in s-and r-processes. As is seen from Table 4 and Fig. 6, star BD +73 566 has much stronger lines of elements produced in s-and r-processes and consequently much higher abundances of such elements. According to the definition of Beers & Christlieb (2005), BD +73 566, with its [Ba/Fe] = 1.62 and [Ba/Eu] = 0.98, falls in the category of the s-process-enhanced stars.
[El/Fe] ratios for the programme and comparison stars (except BD +73 566) are plotted in Fig. 8. For the comparison we used six stars of the thin-disc observed in our work as well as data from other studies of thin-disc stars (Mishenina et al. 2013; Mashonkina et al. 2007; Reddy et al. 2006, 2003; Brewer & Carney 2006; Bensby et al. 2005; Koch & Edvardsson 2002; Gratton & Sneden 1994; Edvardsson et al. 1993). The comparison was made also with the Galactic thin disc chemical evolution models by Pagel & Tautvaišienė (1997).
In Fig. 8 we see that the abundances of yttrium and barium, which are produced mainly in the s-process, are the same as in the thin-disc stars. The abundances of chemical elements for which the r-process contribution is higher or dominating are higher than in the thin disc. This is the case for europium, samarium, and praseodymium. The element-to-iron ratios for these elements in Group 3 stars are higher than in the investigated comparison stars and other thin-disc stars. For zirconium, lanthanum, cerium, and neodymium, Group 3 and the comparison stars have approximately similar element-to-iron ratios.
The similar pattern of n-capture element-to-iron ratios is observed in thick-disc stars (e.g. Mashonkina & Gehren 2000; Prochaska et al. 2000; Tautvaišienė et al. 2001; Bensby et al. 2005; Reddy et al. 2006; Reddy & Lambert 2008; Mishenina et al. 2013). A thick-disc-like overabundance of α-elements was found in these stars as well (Paper I). In Table 5 we show the comparison of mean [El/Fe] values for stars of Group 3 and thick-disc stars at the same metallicity interval −0.8 < [Fe/H] < −0.5. In this metallicity interval lie almost all stars of Group 3. The comparison was made with stars from three thick-disc studies: ten stars lying in the mentioned metallicity interval were taken from Bensby et al. (2005), 44 stars from Reddy et al. (2006), and six stars from Mishenina et al. (2013). Clearly, Group 3 stars and thick-disc stars are of similar chemical composition. The deviations do not exceed the uncertainties of chemical composition determinations.
As we outlined in Paper I, the similar chemical composition of stars in Group 3 and thick-disc stars might suggest that their formation histories are linked. In this context it is important to note that the recent chemical composition study of two stellar streams in the Galaxy also have shown thick-disc like abundances of elements. This was found in Ramya et al. (2012), who investigated abundances of 20 elements in Arcturus and AF06 stellar streams. The authors referred to dynamical interactions within the Galaxy as the most probable scenario for the origin of these two streams. However, it is not clear how perturbations can create streams with such a very high velocity drag and at the same time exhibit very tight abundance trends.
Comparison with thick-disc studies.
Thus, as was pointed out by Helmi et al. (2006) and by us in Paper I, Group 3 can not be uniquely associated to a single traditional Galactic component. The chemical composition together with the kinematic properties and ages of stars in the investigated Group 3 of the Geneva-Copenhagen survey support a gas-rich satellite merger scenario as most suitable for Group 3 origin. A gas-rich satellite merger may be responsible for the formation of the Galactic thick-disc as well (Samland & Gerhard 2003; Brook et al. 2004, 2005; Dierickx et al. 2010; Wilson et al. 2011; Di Matteo et al. 2011).
4. Conclusions
Using high-resolution spectra, we measured abundances of chemical elements produced by s- and r-processes in stars attributed to Group 3 of the Geneva-Copenhagen survey. This kinematically identified group of stars was suspected to be a remnant of a disrupted satellite galaxy. Our main goal was to investigate the homogeneity of the chemical composition of the stars within the group and to compare them with Galactic disc stars.
Our study of 20 stars in Group 3 shows the following:
-
1.
The abundances of chemical elements produced mainly by the s-process are similar to those in the Galactic thin-disc dwarfs of the same metallicity.
-
2.
The abundances of chemical elements produced predominantly by the r-process are overabundant in comparison with Galactic thin-disc dwarfs of the same metallicity. The most prominent overabundances are seen for europium, samarium, and praseodymium.
-
3.
The chemical composition of stars in Group 3 is similar to the thick-disc stars, which might suggest that their formation histories are linked.
-
4.
BD +73 566 is an s-process-enhanced star.
-
5.
Group 3 consists of a 12-Gyr-old population.
-
6.
The chemical composition together with the kinematic properties and ages of stars in the investigated Group 3 of the Geneva-Copenhagen survey support a gas-rich satellite merger scenario as the most suitable origin for Group 3.
Other kinematic groups of the Geneva-Copenhagen survey will be analysed in forthcoming papers of this series.
We use the customary spectroscopic notation [X/Y] ≡ log 10(NX/NY)star − log 10(NX/NY)⊙.
Acknowledgments
The data are based on observations made with the Nordic Optical Telescope, operated on the island of La Palma jointly by Denmark, Finland, Iceland, Norway, and Sweden, in the Spanish Observatorio del Roque de los Muchachos of the Instituto de Astrofisica de Canarias. The research leading to these results has received funding from the European Community’s Seventh Framework Programme (FP7/2007-2013) under grant agreement number RG226604 (OPTICON). B.N. acknowledges support from the Danish Research council. This research has made use of Simbad, VALD and NASA ADS databases. We thank the anonymous referee for insightful questions and comments.
References
- Anstee, S. D., & O’Mara, B. J. 1995, MNRAS, 276, 859 [NASA ADS] [CrossRef] [Google Scholar]
- Barklem, P. S., & O’Mara, B. J. 1997, MNRAS, 290, 102 [Google Scholar]
- Barklem, P. S., O’Mara, B. J., & Ross, J. E. 1998, MNRAS, 296, 1057 [Google Scholar]
- Beers, T. C., & Christlieb, N. 2005, ARA&A, 43, 531 [NASA ADS] [CrossRef] [Google Scholar]
- Bensby, T., Feltzing, S., Lundström, I., & Ilyin, I. 2005, A&A, 433, 185 [NASA ADS] [CrossRef] [EDP Sciences] [Google Scholar]
- Biehl, D. 1976, Ph.D. Thesis, Kiel University [Google Scholar]
- Brewer, M.-M., & Carney, B. W. 2006, AJ, 131, 431 [NASA ADS] [CrossRef] [Google Scholar]
- Brook, C. B., Kawata, D., Gibson, B. K., & Freeman, K. C. 2004, ApJ, 612, 894 [NASA ADS] [CrossRef] [Google Scholar]
- Brook, C. B., Gibson, B. K., Martel, H., & Kawata, D. 2005, ApJ, 630, 298 [NASA ADS] [CrossRef] [Google Scholar]
- Demarque, P., Woo, J.-H., Kim, Y.-C., & Yi, S. K. 2004, ApJS, 155, 667 [NASA ADS] [CrossRef] [Google Scholar]
- Di Matteo, P., Lehnert, M. D., Qu, Y., & van Driel, W. 2011, A&A, 525, L3 [NASA ADS] [CrossRef] [EDP Sciences] [Google Scholar]
- Dierickx, M., Klement, R., Rix, H.-W., & Liu, C. 2010, ApJ, 725, L186 [NASA ADS] [CrossRef] [Google Scholar]
- Edvardsson, B., Andersen, J., Gustafsson, B., et al. 1993, A&A, 275, 101 [NASA ADS] [Google Scholar]
- Gratton, R. G., & Sneden, C. 1994, A&A, 287, 927 [NASA ADS] [Google Scholar]
- Grevesse, N., & Sauval, A. J. 2000, Origin of Elements in the Solar System, Implications of Post-1957 Observations, 261 [Google Scholar]
- Gurtovenko, E. A., & Kostyk, R. I. 1989, Kiev Izdatel Naukova Dumka, [Google Scholar]
- Gustafsson, B., Edvardsson, B., Eriksson, K., et al. 2008, A&A, 486, 951 [NASA ADS] [CrossRef] [EDP Sciences] [Google Scholar]
- Helmi, A. 2008, A&ARv, 15, 145 [CrossRef] [Google Scholar]
- Helmi, A., Navarro, J. F., Nordström, B., et al. 2006, MNRAS, 365, 1309 [NASA ADS] [CrossRef] [Google Scholar]
- Holmberg, J., Nordström, B., & Andersen, J. 2007, A&A, 475, 519 [NASA ADS] [CrossRef] [EDP Sciences] [MathSciNet] [Google Scholar]
- Holmberg, J., Nordström, B., & Andersen, J. 2009, A&A, 501, 941 [NASA ADS] [CrossRef] [EDP Sciences] [Google Scholar]
- Ivans, I. I., Simmerer, J., Sneden, C., et al. 2006, ApJ, 645, 613 [NASA ADS] [CrossRef] [Google Scholar]
- Klement, R., Rix, H.-W., Flynn, C., et al. 2009, ApJ, 698, 865 [NASA ADS] [CrossRef] [Google Scholar]
- Koch, A., & Edvardsson, B. 2002, A&A, 381, 500 [NASA ADS] [CrossRef] [EDP Sciences] [Google Scholar]
- Kurucz, R. L. 2005, Mem. Soc. Astron. It. Suppl., 8, 189 [Google Scholar]
- Lawler, J. E., Bonvallet, G., & Sneden, C. 2001a, ApJ, 556, 452 [NASA ADS] [CrossRef] [Google Scholar]
- Lawler, J. E., Wickliffe, M. E., den Hartog, E. A., & Sneden, C. 2001b, ApJ, 563, 1075 [CrossRef] [Google Scholar]
- Lawler, J. E., Den Hartog, E. A., Sneden, C., & Cowan, J. J. 2006, ApJS, 162, 227 [NASA ADS] [CrossRef] [Google Scholar]
- Mäckle, R., Griffin, R., Griffin, R., & Holweger, H. 1975, A&AS, 19, 303 [NASA ADS] [Google Scholar]
- Mashonkina, L., & Gehren, T. 2000, A&A, 364, 249 [NASA ADS] [Google Scholar]
- Mashonkina, L. I., Vinogradova, A. B., Ptitsyn, D. A., Khokhlova, V. S., & Chernetsova, T. A. 2007, Astron. Rep., 51, 903 [NASA ADS] [CrossRef] [Google Scholar]
- Mishenina, T. V., Pignatari, M., Korotin, S. A., et al. 2013, A&A, 552, A128 [NASA ADS] [CrossRef] [EDP Sciences] [Google Scholar]
- McWilliam, A. 1998, AJ, 115, 1640 [NASA ADS] [CrossRef] [Google Scholar]
- Nissen, P. E., & Schuster, W. J. 2010, A&A, 511, L10 [NASA ADS] [CrossRef] [EDP Sciences] [Google Scholar]
- Nordström, B., Mayor, M., Andersen, J., et al. 2004, A&A, 418, 989 [NASA ADS] [CrossRef] [EDP Sciences] [Google Scholar]
- Pagel, B. E. J., & Tautvaišienė, G. 1995, MNRAS, 276, 505 [NASA ADS] [CrossRef] [Google Scholar]
- Pagel, B. E. J., & Tautvaišienė, G. 1997, MNRAS, 288, 108 [NASA ADS] [CrossRef] [Google Scholar]
- Piskunov, N. E., Kupka, F., Ryabchikova, T. A., Weiss, W. W., & Jeffery, C. S. 1995, A&AS, 112, 525 [NASA ADS] [Google Scholar]
- Prochaska, J. X., Naumov, S. O., Carney, B. W., McWilliam, A., & Wolfe, A. M. 2000, AJ, 120, 2513 [NASA ADS] [CrossRef] [Google Scholar]
- Ramya, P., Reddy, B. E., & Lambert, D. L. 2012, MNRAS, 425, 3188 [NASA ADS] [CrossRef] [Google Scholar]
- Reddy, B. E., & Lambert, D. L. 2008, MNRAS, 391, 95 [Google Scholar]
- Reddy, B. E., Lambert, D. L., & Allen de Prieto, C. 2006, MNRAS, 367, 1329 [NASA ADS] [CrossRef] [Google Scholar]
- Reddy, B. E., Tomkin, J., Lambert, D. L., & Allen de Prieto, C. 2003, MNRAS, 340, 304 [NASA ADS] [CrossRef] [Google Scholar]
- Roederer, I. U., Lawler, J. E., Sneden, C., et al. 2008, ApJ, 675, 723 [NASA ADS] [CrossRef] [Google Scholar]
- Samland, M., & Gerhard, O. E. 2003, A&A, 399, 961 [NASA ADS] [CrossRef] [EDP Sciences] [Google Scholar]
- Sesar, B., Cohen, J. G., Levitan, D., et al. 2012, ApJ, 755, 134 [NASA ADS] [CrossRef] [Google Scholar]
- Simmons, G. J., & Blackwell, D. E. 1982, A&A, 112, 209 [NASA ADS] [Google Scholar]
- Sneden, C., Cowan, J. J., & Gallino, R. 2008, ARA&A, 46, 241 [NASA ADS] [CrossRef] [EDP Sciences] [Google Scholar]
- Sneden, C., Lawler, J. E., Cowan, J. J., Ivans, I. I., & Den Hartog, E. A. 2009, ApJS, 182, 80 [NASA ADS] [CrossRef] [Google Scholar]
- Stonkutė, E., Tautvaišienė, G., Nordström, B., & Ženovienė, R. 2012, A&A, 541, A157 (Paper I) [NASA ADS] [CrossRef] [EDP Sciences] [Google Scholar]
- Tautvaišienė, G., Edvardsson, B., Tuominen, I., & Ilyin, I. 2001, A&A, 380, 578 [NASA ADS] [CrossRef] [EDP Sciences] [Google Scholar]
- Tautvaišienė, G., Geisler, D., Wallerstein, G., et al. 2007, AJ, 134, 2318 [NASA ADS] [CrossRef] [Google Scholar]
- Ting, Y.-S., Freeman, K. C., Kobayashi, C., De Silva, G. M., & Bland-Hawthorn, J. 2012, MNRAS, 421, 1231 [NASA ADS] [CrossRef] [Google Scholar]
- Tolstoy, E., Hill, V., & Tosi, M. 2009, ARA&A, 47, 371 [NASA ADS] [CrossRef] [Google Scholar]
- Unsöld A. 1955, Physik der Stern Atmosphären (Zweite Auflage) (Berlin: Springer-Verlag) [Google Scholar]
- van der Kruit, P. C., & Freeman, K. C. 2011, ARA&A, 49, 301 [NASA ADS] [CrossRef] [Google Scholar]
- Villalobos, Á., & Helmi, A. 2009, MNRAS, 399, 166 [NASA ADS] [CrossRef] [Google Scholar]
- Wilson, M. L., Helmi, A., Morrison, H. L., et al. 2011, MNRAS, 413, 2235 [NASA ADS] [CrossRef] [Google Scholar]
- Wyse, R. F. G. 2009, IAU Symp., 258, 11 [NASA ADS] [Google Scholar]
- Yi, S., Demarque, P., Kim, Y.-C., et al. 2001, ApJS, 136, 417 [NASA ADS] [CrossRef] [Google Scholar]
- Zuckerman, B., & Song, I. 2004, ARA&A, 42, 685 [NASA ADS] [CrossRef] [MathSciNet] [Google Scholar]
All Tables
Effects on derived abundances resulting from model changes for the star HD 224930.
Elemental abundances of Fe and neutron capture elements for the programme and comparison stars.
All Figures
|
Fig. 1 Synthetic spectrum fit to the yttrium line at 5402 Å and barium line at 5853 Å. The observed spectrum for the programme star HD 204848 is shown as dots. The grey lines are synthetic spectra with [Y/Fe] = 0.33 ± 0.10 and [Ba/Fe] = 0.25 ± 0.10, respectively. |
| In the text | |
|
Fig. 2 Synthetic spectrum fit to the Zr i line at 4688 Å and Zr ii line at 5112 Å. The grey lines are synthetic spectra with [Zr i/Fe] = 0.40 ± 0.10 and [Zr ii/Fe] = 0.38 ± 0.10, respectively. The observed spectrum for the programme star HD 204848 is shown as dots. |
| In the text | |
|
Fig. 3 Synthetic spectrum fit to the lanthanum line at 4662 Å and cerium line at 5274 Å. The observed spectrum for the programme star HD 204848 is shown as dots. The grey lines are synthetic spectra with [La/Fe] = 0.20 ± 0.10 and [Ce/Fe] = 0.10 ± 0.10, respectively. |
| In the text | |
|
Fig. 4 Synthetic spectrum fit to the praseodymium line at 5259 Å and neodymium line at 5276 Å. The observed spectrum for the programme star HD 204848 is shown as dots. The grey lines are synthetic spectra with [Pr/Fe] = 0.20 ± 0.10 and [Nd/Fe] = 0.38 ± 0.10, respectively. |
| In the text | |
|
Fig. 5 Synthetic spectrum fit to the Eu ii lines at 4129 and 6645 Å. The grey lines are synthetic spectra with [Eu/Fe] = 0.33 ± 0.10 and [Eu/Fe] = 0.37 ± 0.10 for these two lines, respectively. The observed spectrum for the programme star HD 170737 is shown as dots. |
| In the text | |
|
Fig. 6 NOT-FIES spectra of the programme stars HD 201889 and BD +73 566. These two spectra are over-plotted to see the difference in spectral lines of elements produced in s-and r-processes while lines of other chemical elements are similar. |
| In the text | |
|
Fig. 7 HR diagram of the Group 3 stars. Yi et al. (2001) isochrones representing three different ages and metallicities are shown. The filled circles correspond to the investigated stars with the spectroscopic effective temperatures taken from Paper I. Isochrones are with [α/Fe] = 0.4 dex. |
| In the text | |
|
Fig. 8 Elemental abundance ratios of stars in Group 3 (filled circles) and comparison stars (open circles). The star BD +35 3659, which was removed from Group 3, is marked by an asterisk. For this comparison the data for Milky Way thin-disc dwarfs are plotted: Mishenina et al. (2013, dots), Mashonkina et al. (2007, crosses), Reddy et al. (2006, 2003, squares), Brewer & Carney (2006, diamonds), Bensby et al. (2005, stars), Koch & Edvardsson (2002, upside down triangles), Gratton & Sneden (1994, triangles), Edvardsson et al. (1993, plus signs). Solid lines show the Galactic thin-disc chemical evolution models by Pagel & Tautvaišienė (1997). Average uncertainties are shown in the box for zirconium. |
| In the text | |
Current usage metrics show cumulative count of Article Views (full-text article views including HTML views, PDF and ePub downloads, according to the available data) and Abstracts Views on Vision4Press platform.
Data correspond to usage on the plateform after 2015. The current usage metrics is available 48-96 hours after online publication and is updated daily on week days.
Initial download of the metrics may take a while.