Fig. 5
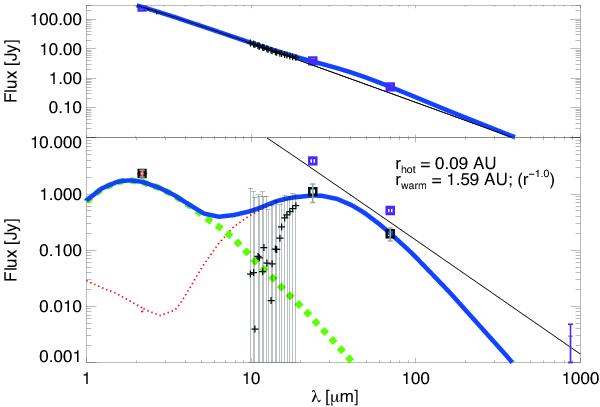
Measured spectral energy distribution, and SED of the best-fitting double-dust belt model (green: hot ring, red: warm belt, blue: total). Top panel: global SED including a NextGen photosphere model (solid black line), bottom panel: circumstellar excess emission. From left to right, thick squares denote the VLTI/VINCI 2.18 μm excess, MIPS 24 μm and Herschel/PACS 70 μm photometry with 1σ error bars. Spitzer/IRS spectrum (grey crosses, not fitted) and ALMA 870 μm photometry (purple cross) are shown as 3σ upper limits.
Current usage metrics show cumulative count of Article Views (full-text article views including HTML views, PDF and ePub downloads, according to the available data) and Abstracts Views on Vision4Press platform.
Data correspond to usage on the plateform after 2015. The current usage metrics is available 48-96 hours after online publication and is updated daily on week days.
Initial download of the metrics may take a while.