Fig. 10
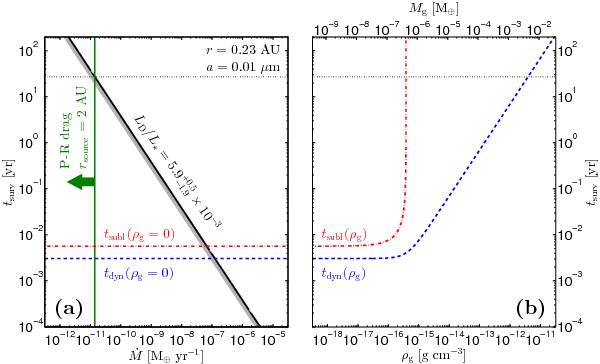
Summary of the constraints on the hot ring, assuming it consists of 0.01 μm carbon grains located at 0.23 AU. Panel a) the diagonal line shows the relation between the mass flux and the dust grain survival timescale, as constrained by the observed fractional luminosity (black, with error margins in grey, Eq. (29)). The horizontal lines indicate the typical timescales (in a gas free environment) for destruction by sublimation (red, dash-dotted, Eq. (30)), and removal by blowout (blue, dashed, Eq. (31)). The vertical line with the arrow indicates the maximum mass flux due to P-R drag from a very dense source region located at 2 AU (green, Eq. (28)). Panel b) the dependence on gas density of the sublimation timescale (red, dash-dotted, Eq. (30)), and the blowout timescale (blue, dashed, the sum in quadrature of Eqs. (31) and (32)) The top axis gives the total gas mass corresponding to the midplane gas densities on the bottom axis, assuming the gas is located in a vertically isothermal ring of width Δr = r (Eq. (34)). The horizontal, black, dotted line marks the minimum survival time required if the observed material is to be provided by PR drag. It extends across both panels to show the gas density and total gas mass this would imply.
Current usage metrics show cumulative count of Article Views (full-text article views including HTML views, PDF and ePub downloads, according to the available data) and Abstracts Views on Vision4Press platform.
Data correspond to usage on the plateform after 2015. The current usage metrics is available 48-96 hours after online publication and is updated daily on week days.
Initial download of the metrics may take a while.