Fig. 13
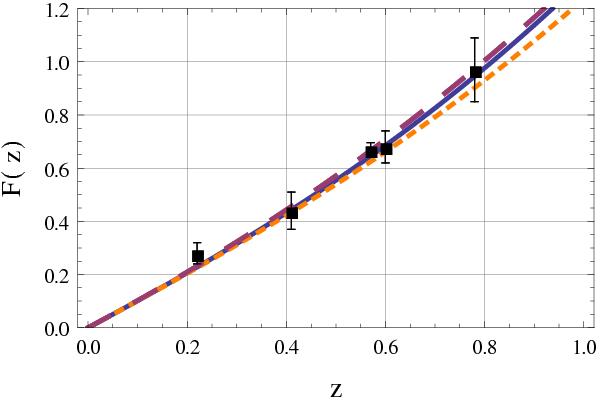
F(z) measurements from different surveys (BOSS and WiggleZ) compared with the prediction for the ΛCDM model (with parameters of Table 5 – dashed purple line) and for Galileon scenarios. The solid blue line stands for the best-fit Galileon scenario using all data, whereas the orange dashed line stands for the best-fit Galileon scenario using growth data only.
Current usage metrics show cumulative count of Article Views (full-text article views including HTML views, PDF and ePub downloads, according to the available data) and Abstracts Views on Vision4Press platform.
Data correspond to usage on the plateform after 2015. The current usage metrics is available 48-96 hours after online publication and is updated daily on week days.
Initial download of the metrics may take a while.