Fig. 4
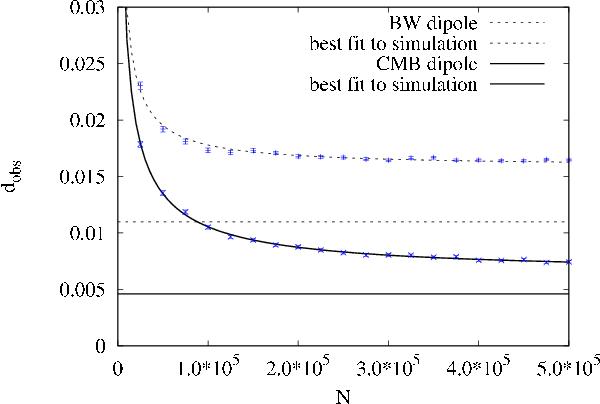
Amplitude bias of the 3-dimensional estimator for the masked NVSS geometry of Singal (2011). Data represent mean and empirical
variance of 1000 simulations for each N. A function
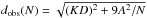 is fitted to the simulated data, with best-fit values
A = 0.883 ± 0.006,
KD = (0.642 ± 0.005) × 10-2 and
A = 0.847 ± 0.016,
KD = (1.59 ± 0.008) × 10-2 for the expected kinetic
radio dipole and the radio dipole measured by Blake
& Wall (2002), respectively. The simulated dipole amplitudes,
without masking, are indicated by the horizontal lines.
is fitted to the simulated data, with best-fit values
A = 0.883 ± 0.006,
KD = (0.642 ± 0.005) × 10-2 and
A = 0.847 ± 0.016,
KD = (1.59 ± 0.008) × 10-2 for the expected kinetic
radio dipole and the radio dipole measured by Blake
& Wall (2002), respectively. The simulated dipole amplitudes,
without masking, are indicated by the horizontal lines.
Current usage metrics show cumulative count of Article Views (full-text article views including HTML views, PDF and ePub downloads, according to the available data) and Abstracts Views on Vision4Press platform.
Data correspond to usage on the plateform after 2015. The current usage metrics is available 48-96 hours after online publication and is updated daily on week days.
Initial download of the metrics may take a while.