Fig. 3
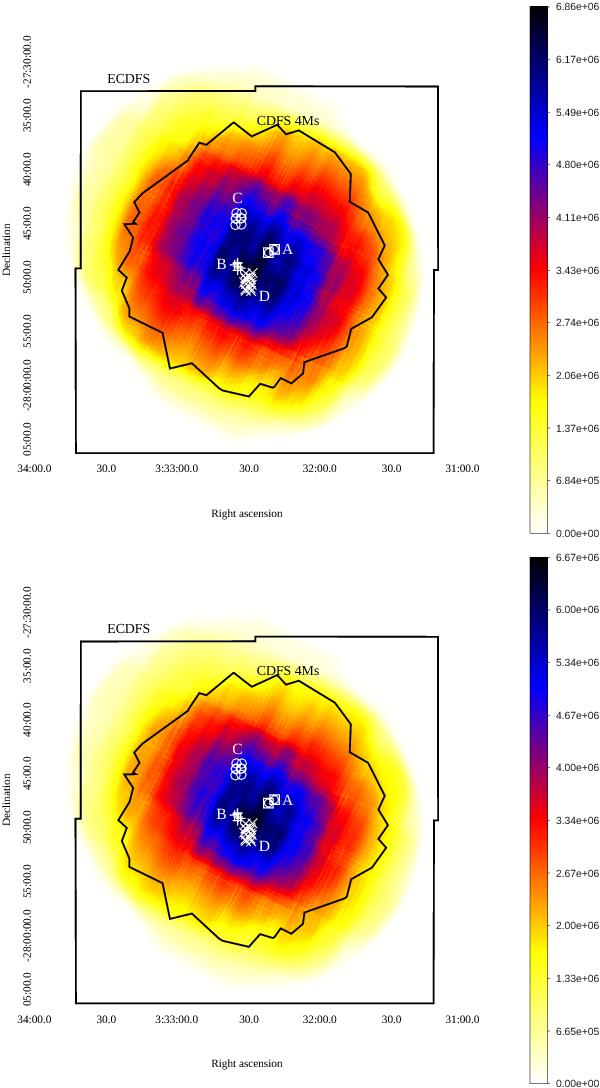
Exposure maps of the XMM-CDFS in the 2 − 10 (left) and 5 − 10 keV (right) bands. The Chandra 4 Ms and ECDS areas, and the pointing positions and groups are superimposed with different symbols and letter marks according to the observing season (see Table 1). The colour wedges show the exposure time in s as the sum of the MOS1, MOS2 and PN exposures.
Current usage metrics show cumulative count of Article Views (full-text article views including HTML views, PDF and ePub downloads, according to the available data) and Abstracts Views on Vision4Press platform.
Data correspond to usage on the plateform after 2015. The current usage metrics is available 48-96 hours after online publication and is updated daily on week days.
Initial download of the metrics may take a while.