Fig. 4
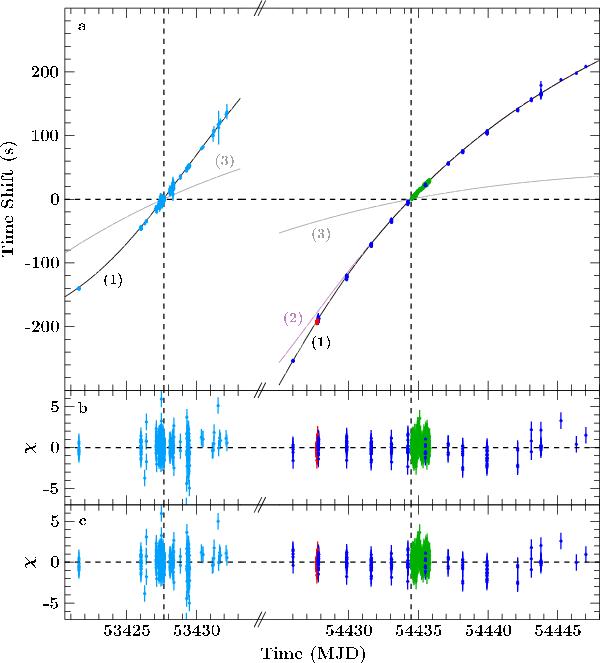
a) Time shifts relative to a constant pulse period for the 2005 and 2007 outbursts from RXTE- (light blue: 2005, dark blue: 2007), Swift- (red) and Suzaku-data (green). The arbitrary reference time for the pulse ephemeris is indicated by the vertical dashed lines. The gray curve (3) shows the effect of the orbital correction using the orbit of Coe et al. (2007) on the arrival times. The best-fit pulse ephemeris based on the revised orbital parameters of Table 2 are shown in black with (1) and purple without a spin-up (2). b) Residuals of the model without taking the times of maximum source flux during outbursts into account. c) Residuals of the best-fit model (1).
Current usage metrics show cumulative count of Article Views (full-text article views including HTML views, PDF and ePub downloads, according to the available data) and Abstracts Views on Vision4Press platform.
Data correspond to usage on the plateform after 2015. The current usage metrics is available 48-96 hours after online publication and is updated daily on week days.
Initial download of the metrics may take a while.