Fig. 13
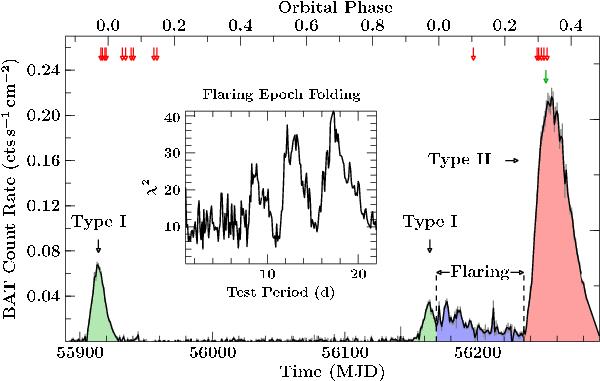
Swift-BAT light curve showing the 2011 December and the 2012 August outburst, which occurred as predicted by the orbital ephemeris (green region), and the unexpected flaring activity after this outburst (blue region) followed by a giant type II outburst at an orbital phase of nearly 0.3 (red region). Times of observation by Swift (red) and Suzaku (green) are shown as arrows on top (compare Table 1). The inset shows the epoch-folding result of the flaring part of the light curve.
Current usage metrics show cumulative count of Article Views (full-text article views including HTML views, PDF and ePub downloads, according to the available data) and Abstracts Views on Vision4Press platform.
Data correspond to usage on the plateform after 2015. The current usage metrics is available 48-96 hours after online publication and is updated daily on week days.
Initial download of the metrics may take a while.