Fig. 3
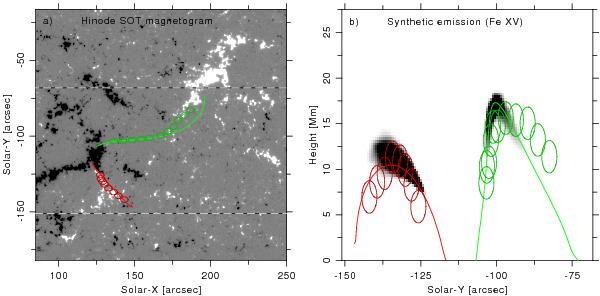
Direct comparison of the model intensity structures with the STEREO 3D reconstruction. Panel a) displays the magnetogram (saturated at ±300 G) at the bottom boundary. Overplotted are the projections of those field lines from the model that cross the maximum of the synthesized emission of the respective loop in the 3D computational domain. The circles show the projection of the loops reconstructed from the STEREO observations. The diameter of the circles indicates the uncertainty in the reconstruction. In panel b) we show the synthesized model intensity in Fe xv (284 Å) as seen from solar east, i.e., along solar-X, again with the 3D reconstruction. The colors denote the core loop (CL 1, green) and the short loop (SL 1, red) as introduced in Fig. 2, see Sect. 4. The dashed white lines in panel a) indicate the range of solar-Y displayed in panel b).
Current usage metrics show cumulative count of Article Views (full-text article views including HTML views, PDF and ePub downloads, according to the available data) and Abstracts Views on Vision4Press platform.
Data correspond to usage on the plateform after 2015. The current usage metrics is available 48-96 hours after online publication and is updated daily on week days.
Initial download of the metrics may take a while.