Fig. 2
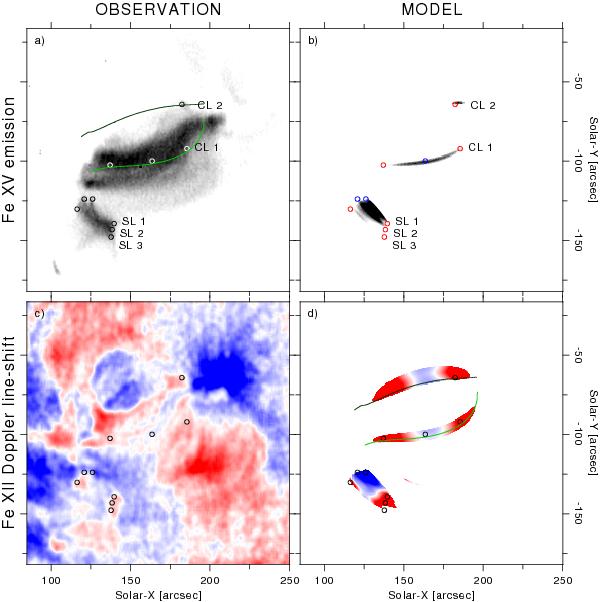
Direct comparison between observations and the 3D MHD forward model. The left column shows the active region as observed by EIS on 14 Nov. 2007. Panel a) displays the intensity map in Fe xv (284 Å) on a linear inverse scale normalized to the peak intensity. For plotting we set a threshold of 1/6 of the peak intensity, which is well above the noise level. In panel c) we plot the Doppler map in Fe xii (195 Å). The scale of the doppler map covers ±10 km s-1, where blue-shifts indicate plasma flows towards the observer. The right column shows the corresponding quantities synthesized from the 3D MHD model with the same color coding. A short loop system can be seen spanning from one of the two main polarities to the network of the quiet Sun (SL 1–3), as well as a loop (system) in the core of the AR between the two main polarities (CL 1). In the model we traced two magnetic field lines, rooted in the centers of CL 1 and 2, that are overplotted in green. The circles are located at the same positions in all panels. The alignment between the observations and synthesized images is accurate within about 3 arcsec corresponding to the diameter of the circles.
Current usage metrics show cumulative count of Article Views (full-text article views including HTML views, PDF and ePub downloads, according to the available data) and Abstracts Views on Vision4Press platform.
Data correspond to usage on the plateform after 2015. The current usage metrics is available 48-96 hours after online publication and is updated daily on week days.
Initial download of the metrics may take a while.